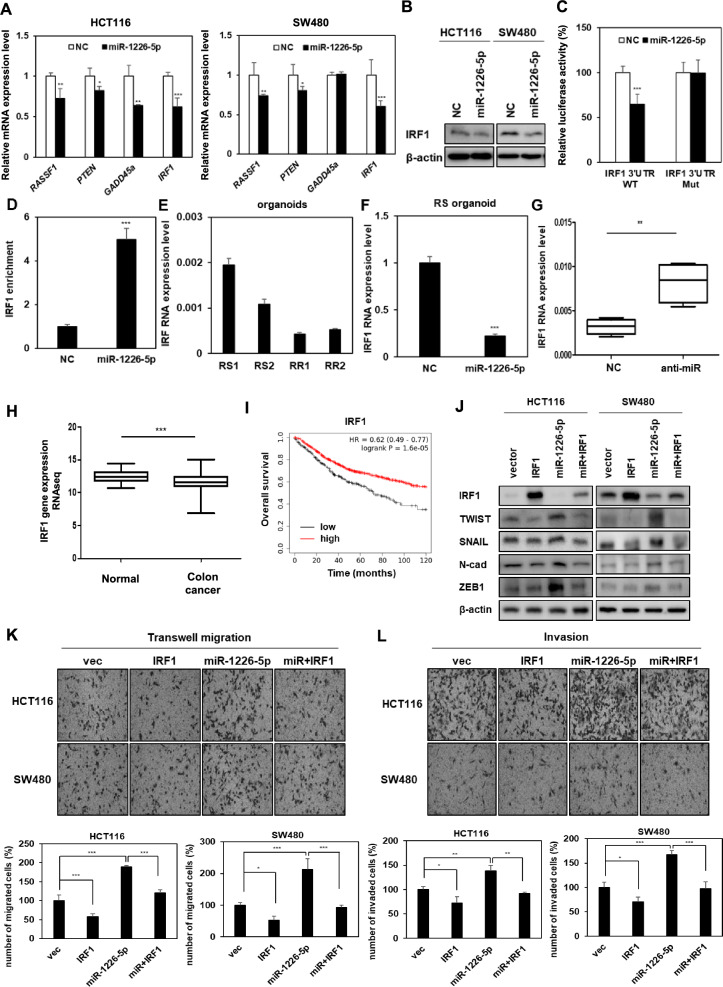
Fig. 2.
miR-1226-5p increases the tumorigenic phenotype by directly suppressing IRF1 expression. A The mRNA levels of candidates selected from TargetScan, a target prediction site for miRNAs, were measured in HCT116 and SW480, respectively. B Protein expression of IRF1 was confirmed in both CRC cells overexpressing miR-1226-5p. C HCT116 cells were co-transfected with wild-type (WT) or mutant (Mut) vectors of IRF1 3'UTR in the presence or absence of miR-1226-5p mimic, and then luciferase activity was examined. D IRF1 enrichment level was confirmed using AGO2-RNA-immunoprecipitation (AGO2-IP) and qRT-PCR analysis in SW480 cells overexpressing NC or miR-1226-5p. E Basal levels of IRF1 were identified in RS and RR CRC patient-derived organoids. F The mRNA level of IRF1 was measured by qRT-PCR when miR-1226-5p was overexpressed in RS organoids. G HCT116-RR cells overexpressing the negative control (NC) or the miR-1226-5p inhibitor (anti-miR-1226-5p) were injected subcutaneously into the flanks of Balb/c nude mice (n = 4; 1 × 10⁷ cells/mouse). The mRNA expression of IRF1 in formed tumor tissues was performed by qRT-PCR. H Expression levels of IRF1 in normal patients (n = 41) and colon cancer patients (n = 469) of TCGA colon cancer (COAD) in Genomic Data Common (GDC) are shown as box and whisker plots. I Kaplan–Meier overall survival curves of colon adenocarcinoma patients according to the expression level of IRF1 were shown. J–L HCT116 and SW480 cells were co-transfected with miR-1226-5p mimic and IRF1 overexpression vector. J Expression of TWIST, SNAIL, N-cadherin, and ZEB1 was confirmed by Western blot analysis in the indicated cells. Transwell migration (K) and matrigel-coated invasion assays (L) were subjected on indicated cells. qRT-PCR was normalized to GAPDH. β-Actin was used for normalization in Western blot analysis. The experiment was repeated three times and representative Western blot images are shown. The data are presented as the mean ± S.D. *P < 0.05; **P < 0.01; ***P < 0.001. Student’s t test and One-way ANOVA followed by bonferroni comparison test

