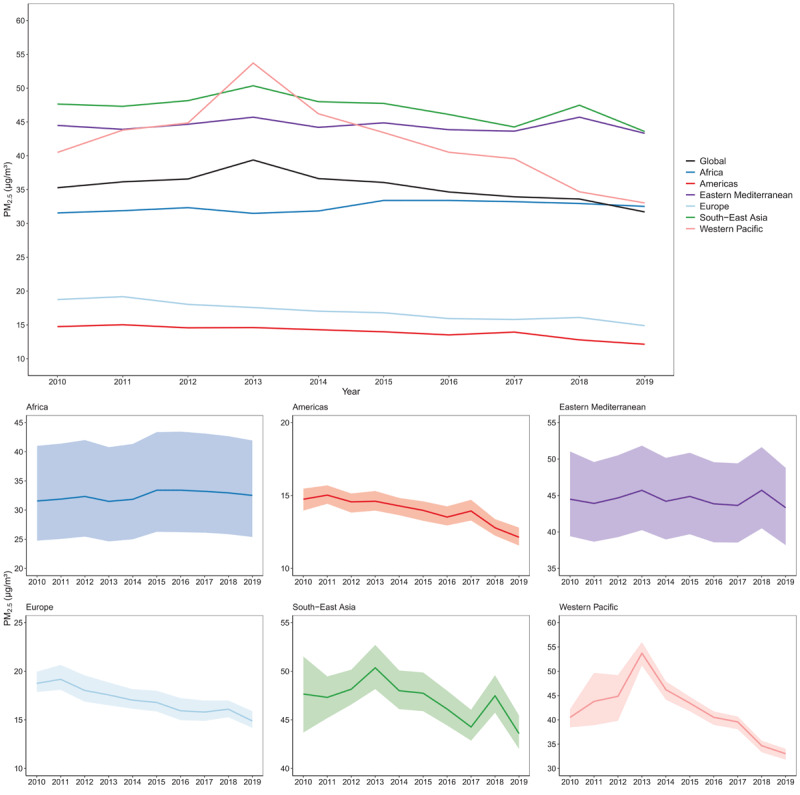
Figure 2.

Trends in mean annual PM2.5 concentrations by WHO regions, 2010–2019.
Note: The shaded areas show uncertainty in estimates.

Trends in mean annual PM2.5 concentrations by WHO regions, 2010–2019.
Note: The shaded areas show uncertainty in estimates.