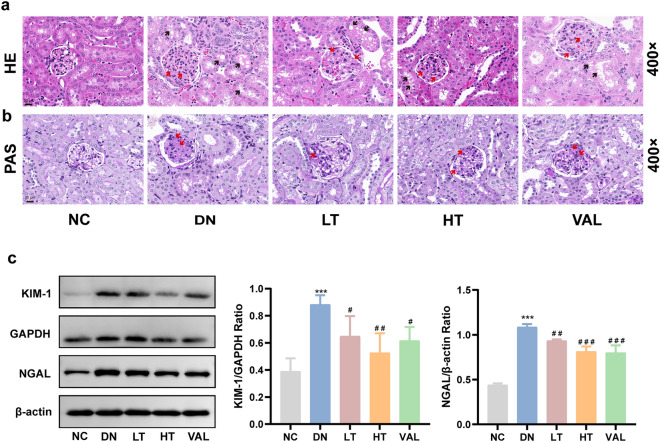
Fig. 4.
Effects of TSN on renal pathology and tubular injury in DN mice. a HE staining of renal tissue (×400, Scale bar: 20 μm). Red arrows indicate mesangial cell proliferation, mesangial matrix deposition. Black arrows indicate protein casts, vacuolar degeneration, proximal tubule microvilli shedding. b PAS staining of renal tissue (×400, Scale bar: 20 μm). Red arrows indicate glycogen deposition. c Western blot bands and quantitative analysis of KIM-1 and NGAL protein levels in renal tissue. NC: normal control group. DN: diabetic nephropathy control group. LT: TSN low dose group. HT: TSN high dose group. VAL: Valsartan treatment group. Data are shown as means ± standard deviations (n = 3). *** p < 0.001, compared with the NC group; # p < 0.05, ## p < 0.01, ### p < 0.001, compared with the DN group

