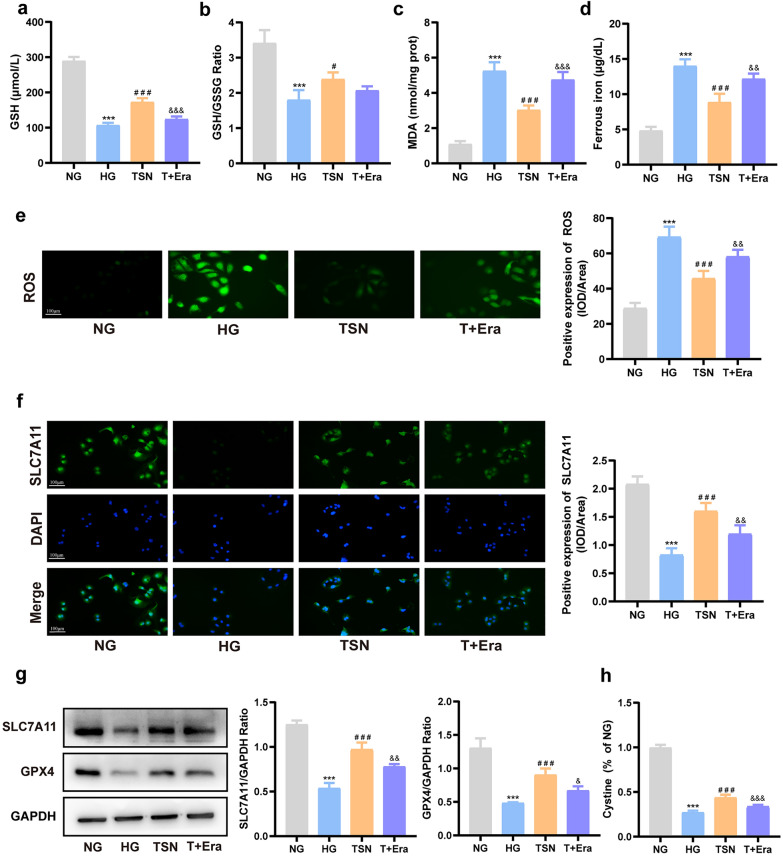
Fig. 9.
TSN protected HK-2 cells from ferroptosis induced by high glucose by regulating the SLC7A11/GSH/GPX4 axis. a GSH content. b GSH/GSSG ratio. c MDA content. d Ferrous ion content. e Representative images and quantitative analysis of ROS (×200, Scale bar: 100 μm). f Immunofluorescence images and quantitative analysis of SLC7A11 protein levels (×200, Scale bar: 100 μm). g Western blot bands and quantitative analysis of SLC7A11 and GPX4 protein levels. h Fluorescence intensity of cystine. NG: normal group. HG: high glucose group. TSN: TSN treatment group. T + Era: TSN + Erastin group. Data are shown as means ± standard deviations (n = 3). *** p < 0.001, compared with the NG group; # p < 0.05, ## p < 0.01, ### p < 0.001, compared with the HG group; & p < 0.05, && p < 0.01, &&& p < 0.001, compared with the TSN group

