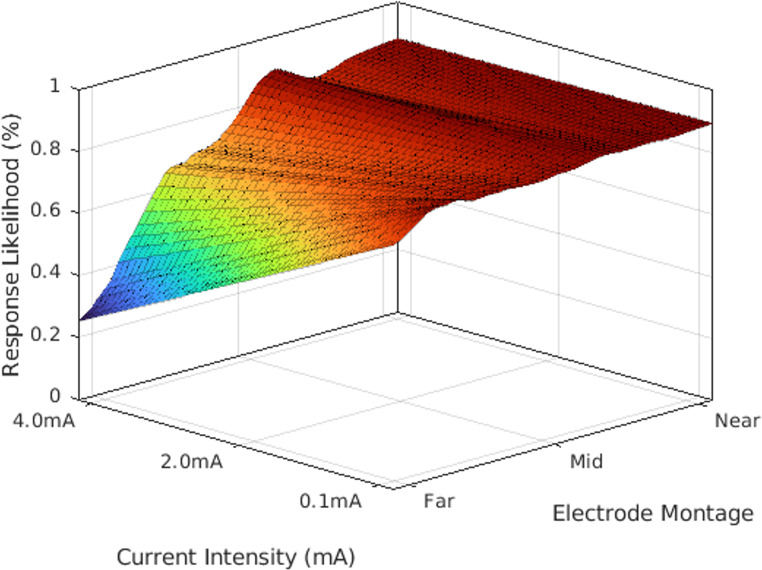
Fig. 3.
A representative optimization space for a single participant. A 5th-degree polynomial fit was applied to demonstrate the gradient of treatment response across multiple parameters. The x-axis represents the applied current intensity in milliamps. The y-axis represents the electrode montage (i.e., the bipolar electrode configuration) by distance from the originally applied montage (e.g., F5/F6). The z-axis represents the statistical likelihood of treatment response for a single participant given the specific combination of parameters

