Figure 3.
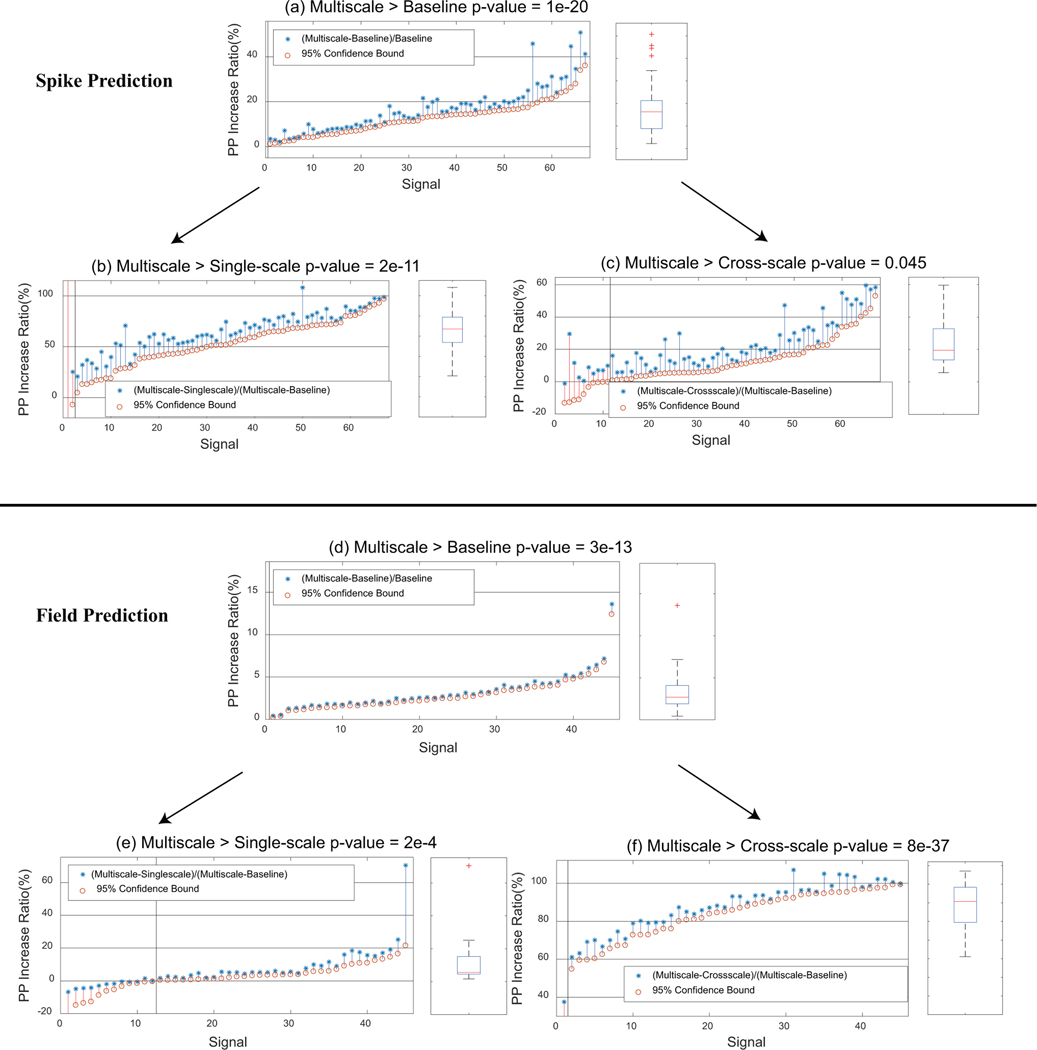
(a–f) Multiscale causalities are successfully detected, thus improving the prediction of spike trains and field potentials. Signals—whether spike train signals in (a–c) or field potential signals in (d–f)—are sorted by the 95% confidence bound of PP increase ratios (these ratios are defined in the legends). PP increase ratios are significantly above 0 for signals to the right of the black vertical lines (p-value<0.05, one-sided t-test). Box plots to the right of each panel show the statistics of significant PP increase ratios, where the central mark is the median, the edges of the box are the 25th and 75th percentiles and the whiskers extend to the most extreme data points that are not outliers. Outliers are shown by red crosses and are points whose distance to the box is larger than 1.5 times of the box height. P-values are shown for comparing the average to 0 by one-sided t-tests. (a–c) Multiscale causalities improve the prediction of spike trains. (a) PP increase ratio from baseline to multiscale. Signals from all 11 sessions with multiscale connections are shown. (b) PP increase ratio from single-scale to multiscale. (c) PP increase ratio from cross-scale to multiscale. (d–f) Multiscale causalities improve the prediction of field potentials. (d) PP increase ratio from baseline to multiscale. Signals from all 11 sessions with multiscale connections are shown. (e) PP increase ratio from single-scale to multiscale. (f) PP increase ratio from cross-scale to multiscale.

