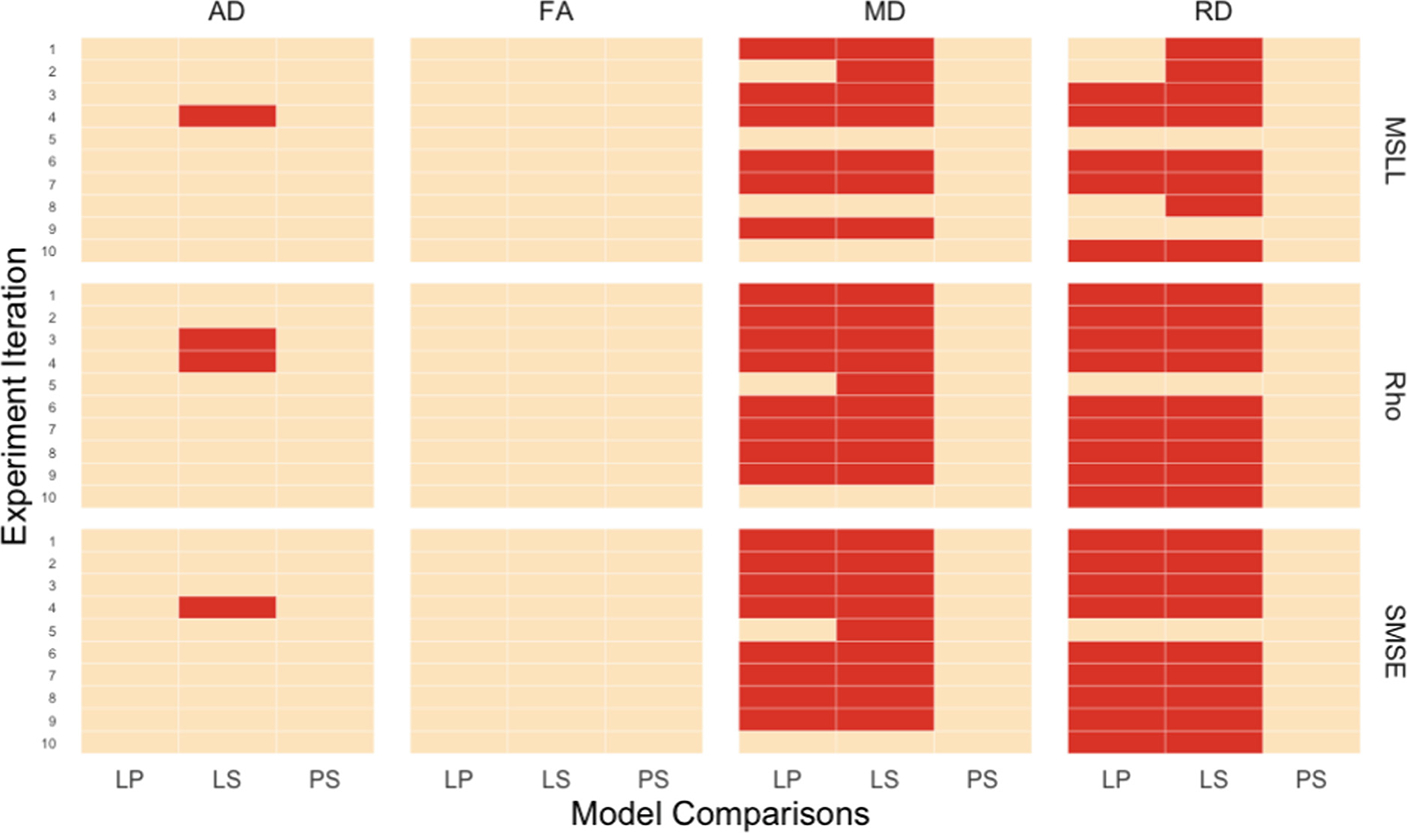
Fig. 1.

Model comparisons for the DTI metrics (AD, FA, MD, RD) on three evaluation metrics: Rho, SMSE, MSLL. Red cells indicate significant differences between the model types. Orange cells indicate non-significant differences. LP: linear vs. polynomial; LS: linear vs. b-spline; PS: polynomial vs. b-spline.
