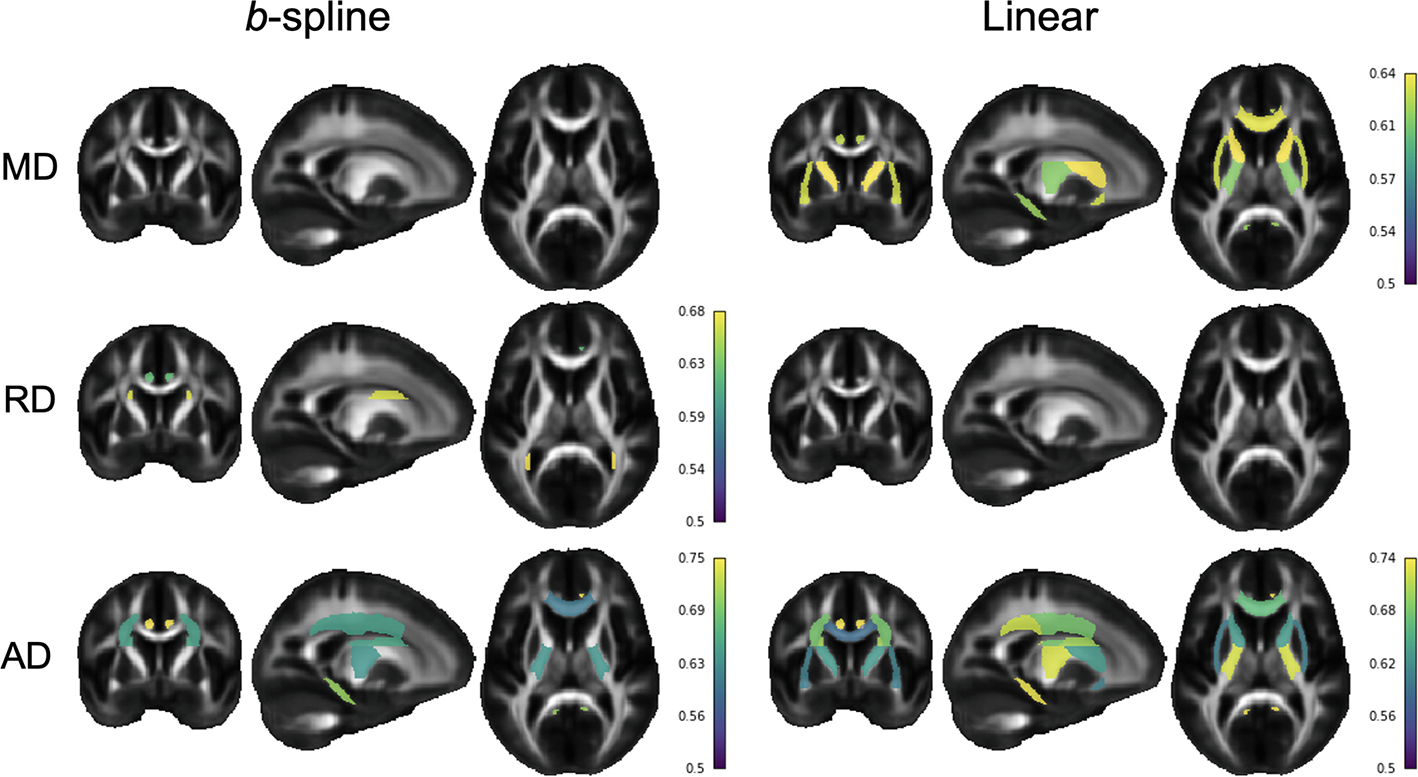
Fig. 2.

Comparison of the significant ROIs between the linear and the b-spline model. Colored ROIs passed FDR in at least 9 out of 10 experimental iterations. Color bars show the mean AUC for the ROIs across iterations. MD = mean diffusivity, AD = axial diffusivity, RD = radial diffusivity.
