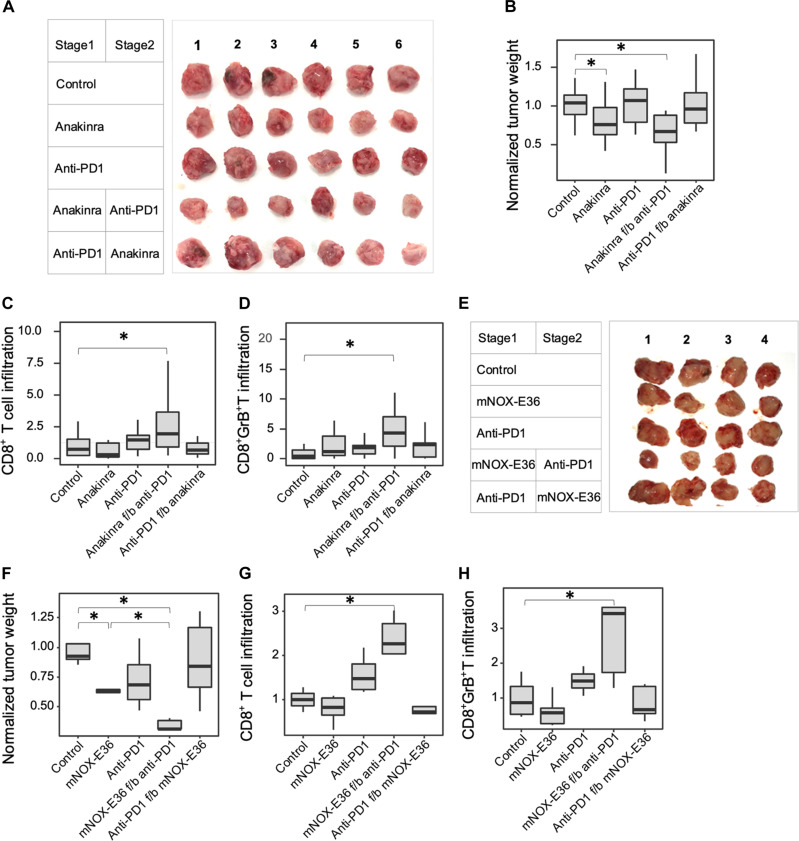
Fig. 2. Inhibition of Notch-regulated cytokines potentiates ICB in 4T1 mammary allografts.
(A) Excised tumors following stage 2 monotherapy (anakinra or anti-PD1) or sequential treatment. (B) Normalized tumor weight (n ≥ 12 tumors per group). (C) Flow cytometric analysis of CD8+ T cell infiltrates after stage 2 (n ≥ 10 tumors per group). (D) Flow cytometric analysis of CD8+GrB+ T cells after stage 2 (n ≥ 10 tumors per group). (E) Tumors excised following stage 2 monotherapy (mNOX-E36 or anti-PD1) or sequential treatment. (F) Normalized tumor weight (n ≥ 4 tumors per group). (G) Flow cytometric analysis of CD8+ T cells after stage 2 (n ≥ 4 tumors per group). (H) Flow cytometric analysis of CD8+GrB+ T cells after stage 2 (n ≥ 4 tumors per group). Bloxplots represent median ± IQR, whiskers indicate 1.5 × IQR. *P < 0.05.

