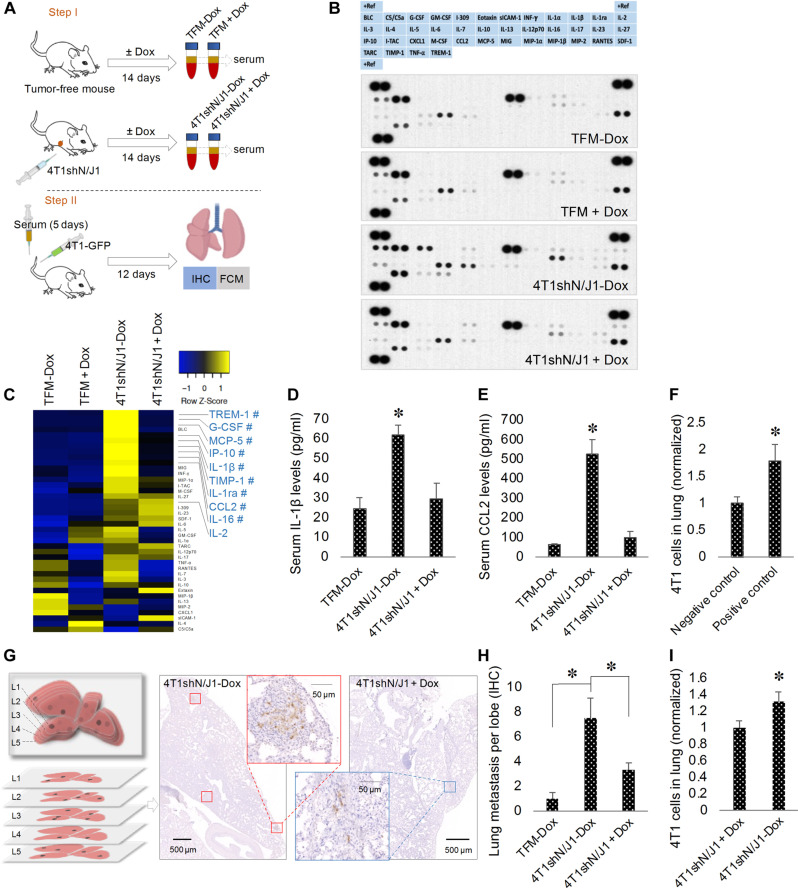
Fig. 4. Notch activation in the primary tumor promotes lung metastases.
(A) Schematic diagram of the experimental design: step I, serum is collected from TFM or mice bearing 4T1shN/J1 allografts (4T1shN/J1) treated with or without doxycycline (±Dox); step II, intravenous injection of serum from step I once per day for 5 days, followed by tail vein injection of 4T1-GFP cells into BALB/c mice and 12 days later, immunohistochemical (IHC) and flow cytometric (FCM) analysis of lung metastasis. (B) Cytokine arrays probed with serum collected in step I. (C) Heatmap of relative cytokine levels measured by array densitometry. The color key relates the heatmap colors to the standard score (z score). Cytokines, not influenced by Dox in TFM, increased >2-fold in 4T1shN/J1-Dox compared to TFM ± Dox serum are shown in blue. # indicates cytokines decreased more than 30% in 4T1shN/J1 + Dox. Serum levels of IL-1β (D) and CCL2 (E) by ELISA (n = 3 mice per group). (F) Flow cytometric analysis of 4T1 cells in lungs from 4T1 tail vein metastases models of untreated mice (negative control) or mice pretreated with intravenous rmIL-1β and rmCCL2 (positive control) (n = 4 mice per group). (G) Schematic diagram showing five 100-μm interval lung sections studied by IHC (left). Representative images of anti-GFP–stained sections of lungs from mice after step II (right). (H) Quantification of lung metastasis from mice after step II. All values are expressed as number of metastatic loci per lobe per mouse (n ≥ 7 mice per group). (I) Flow cytometric analysis of 4T1 cells in lungs from mice after step II (n = 10 mice per group). Data are presented as mean + SEM. *P < 0.05.

