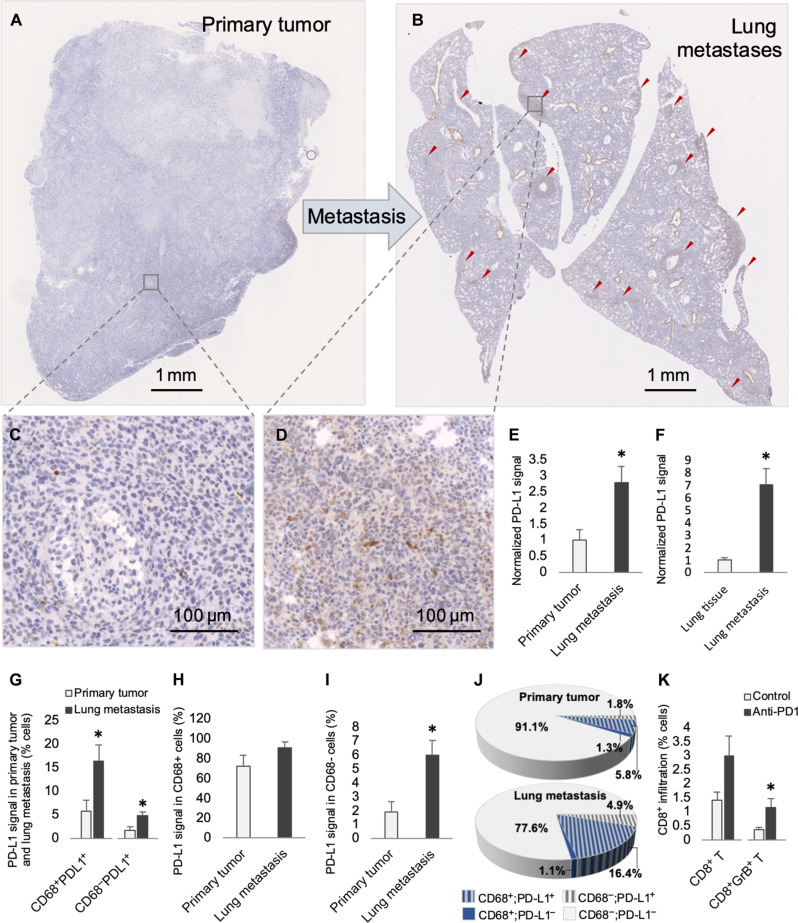
Fig. 5. PD-L1 signal is up-regulated in 4T1 lung metastasis.
Representative images of anti–PD-L1–stained sections of primary tumor (A and C) and paired lung (B and D) following stage 2, vehicle control. (E) Normalized levels of PD-L1+ cells in primary tumor and paired lung metastases (n = 4 mice per group). (F) Normalized levels of PD-L1+ cells in lung metastasis and surrounding lung tissues (n = 4 mice per group). (G) Percent PD-L1+ cells according to CD68 status in primary tumor and paired lung metastasis (n = 4 mice per group). (H) Percent PD-L1+ cells in the CD68+ fraction in primary tumor and paired lung metastasis (n = 4 mice per group). (I) Percent PD-L1+ cells in the CD68− fraction in primary tumor and paired lung metastasis (n = 4 mice per group). (J) Graphical representation of percent cells according to PD-L1 and CD68 status from data shown in (G) to (I). (K) Percent CD8+ or CD8+GrB+ T cells in lung metastases following stage 2, vehicle control or anti-PD1 treatment (n = 6 mice per group). Data are presented as mean + SEM. *P < 0.05.

