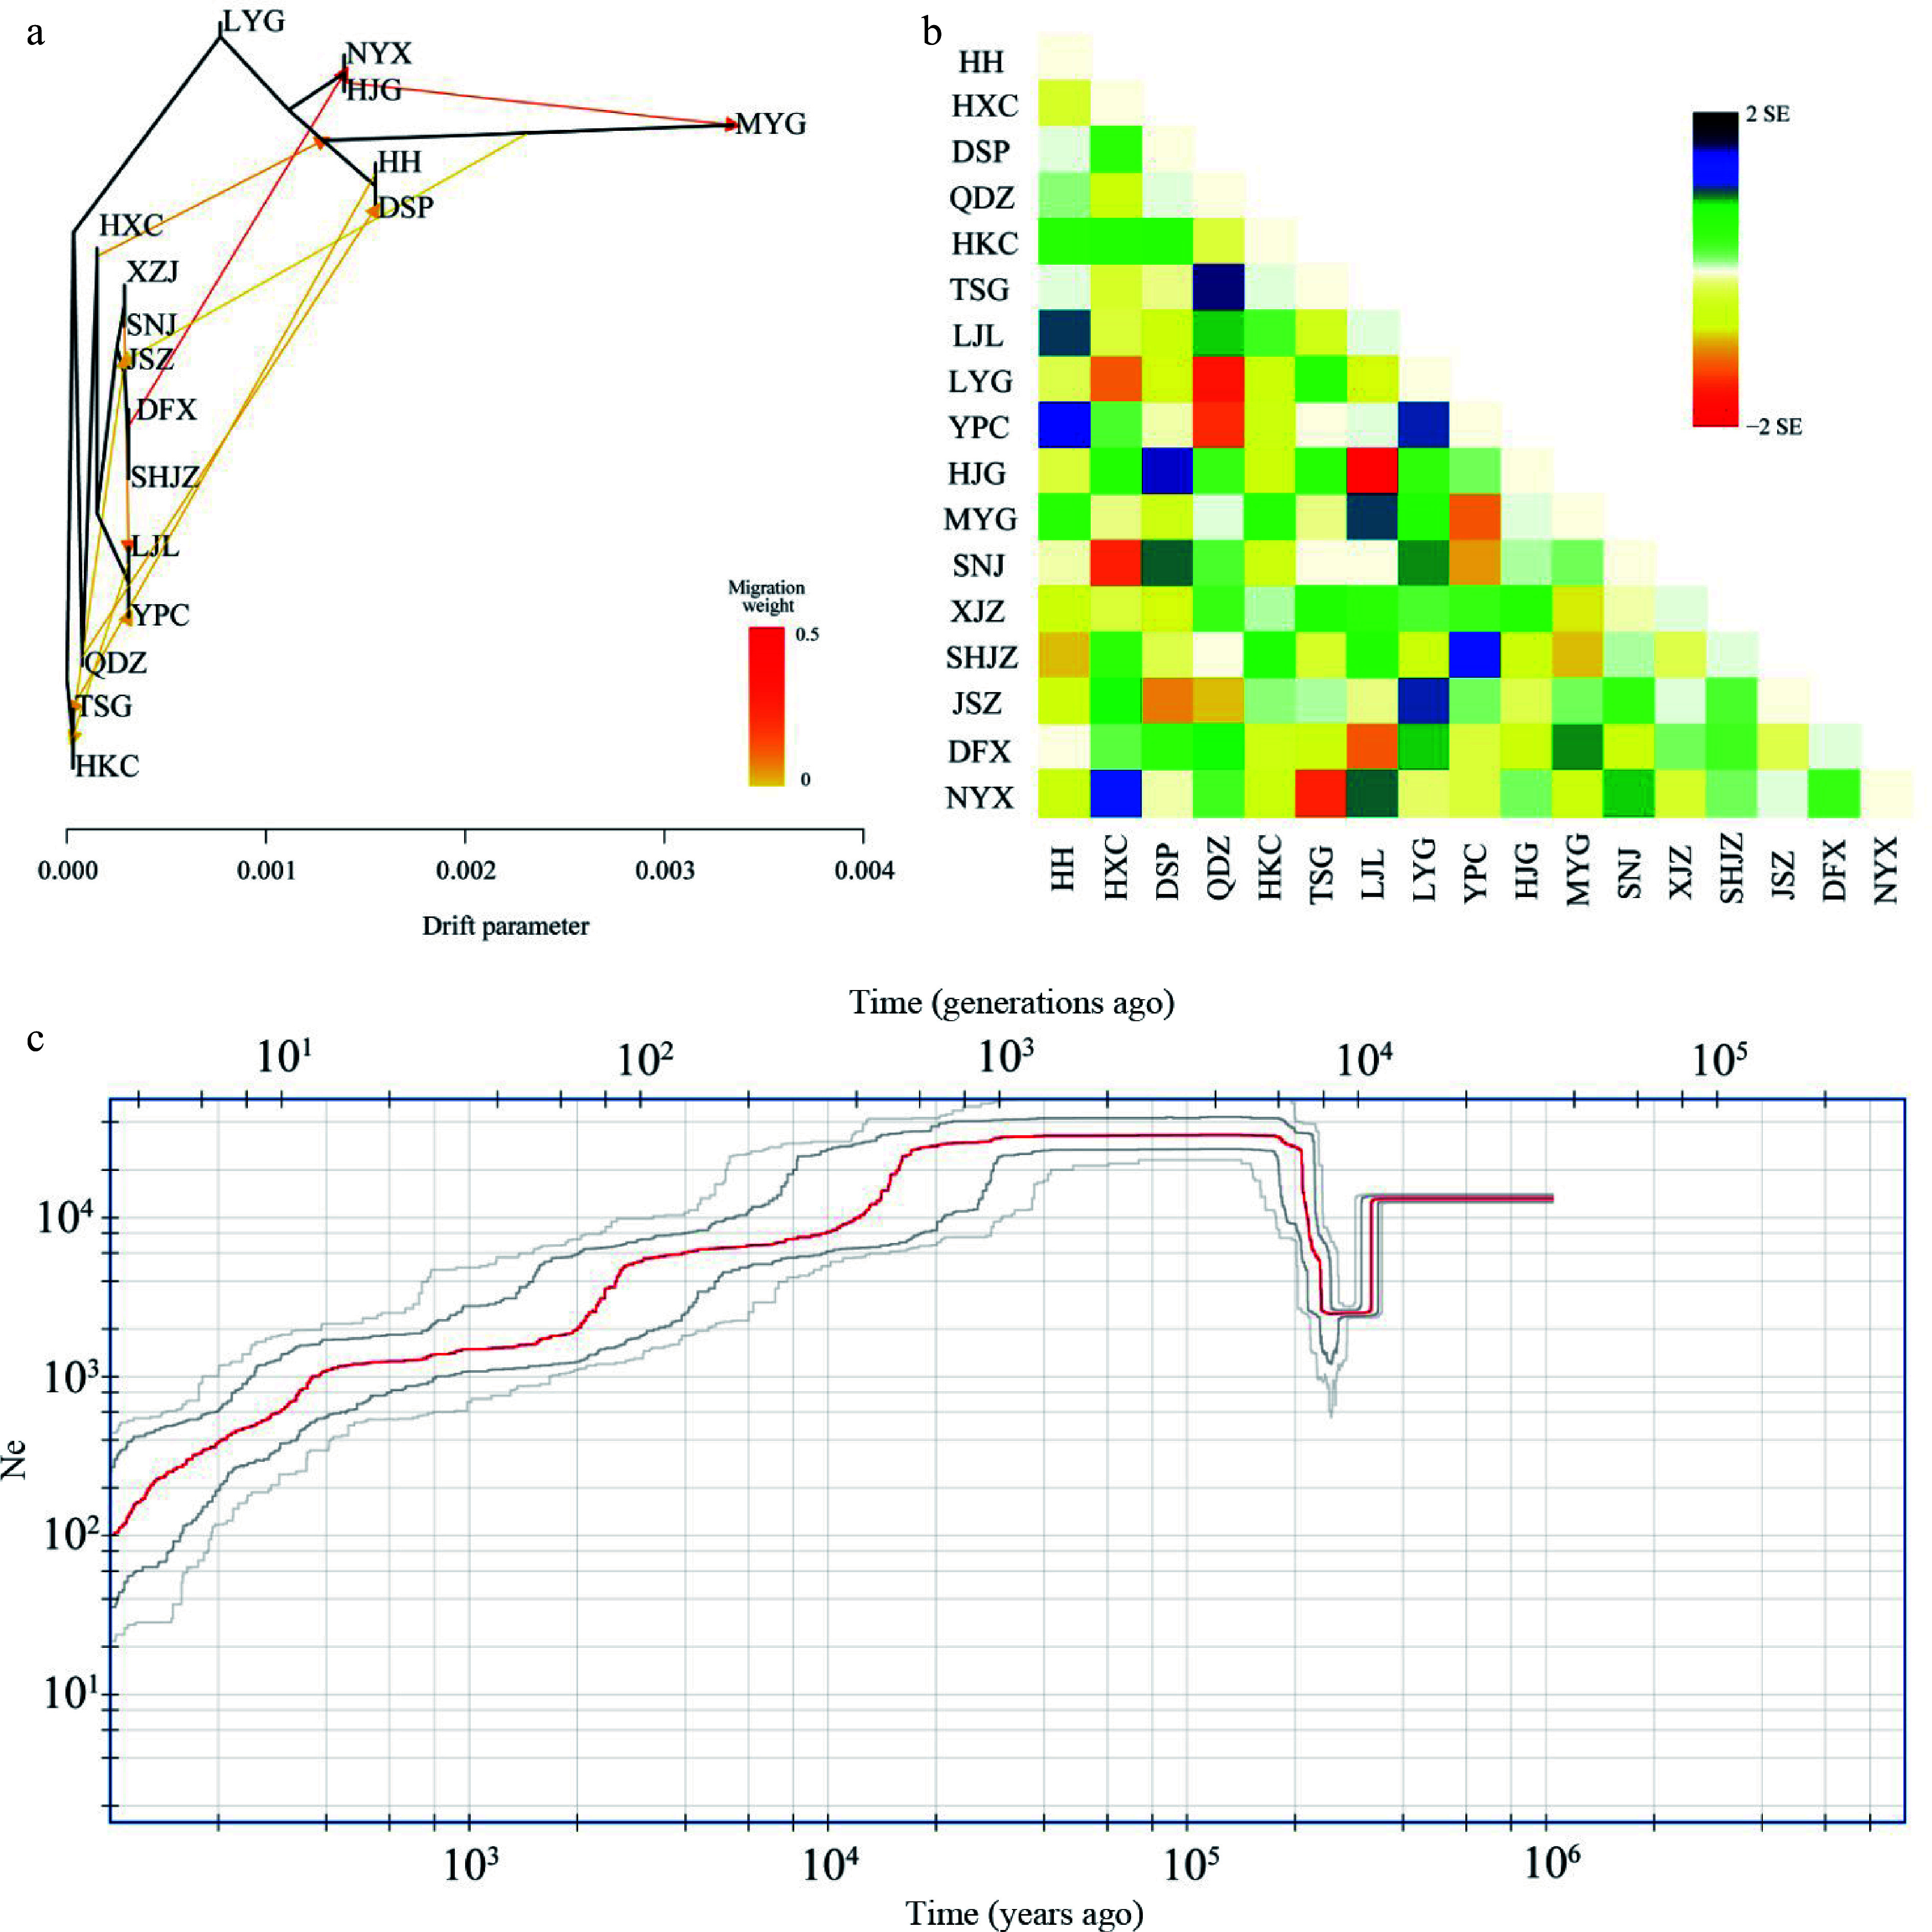
Figure 4.

Hybridization among populations of Pterocarya hupehensis. (a) Maximum likelihood (ML) tree inferred using Treemix; gene-flow events are depicted with arrows, and ten migration events were allowed. Migration arrows are colored according to their weight. Horizontal branch lengths are proportional to the amount of genetic drift that occurred on each branch. The scale bar shows 10× the average standard error of the entries in the sample covariance matrix. (b) Heatmaps of residual fit from the ML tree. Residuals white through blue indicate that the corresponding populations are more closely related to each other than on the ML tree, suggesting confounding events between these populations. (c) Demographic history of P. hupehensis inferred with Stairway Plot 2 using unfolded site frequency spectra. The 95% confidence interval for estimated effective population size is shown with gray lines.
