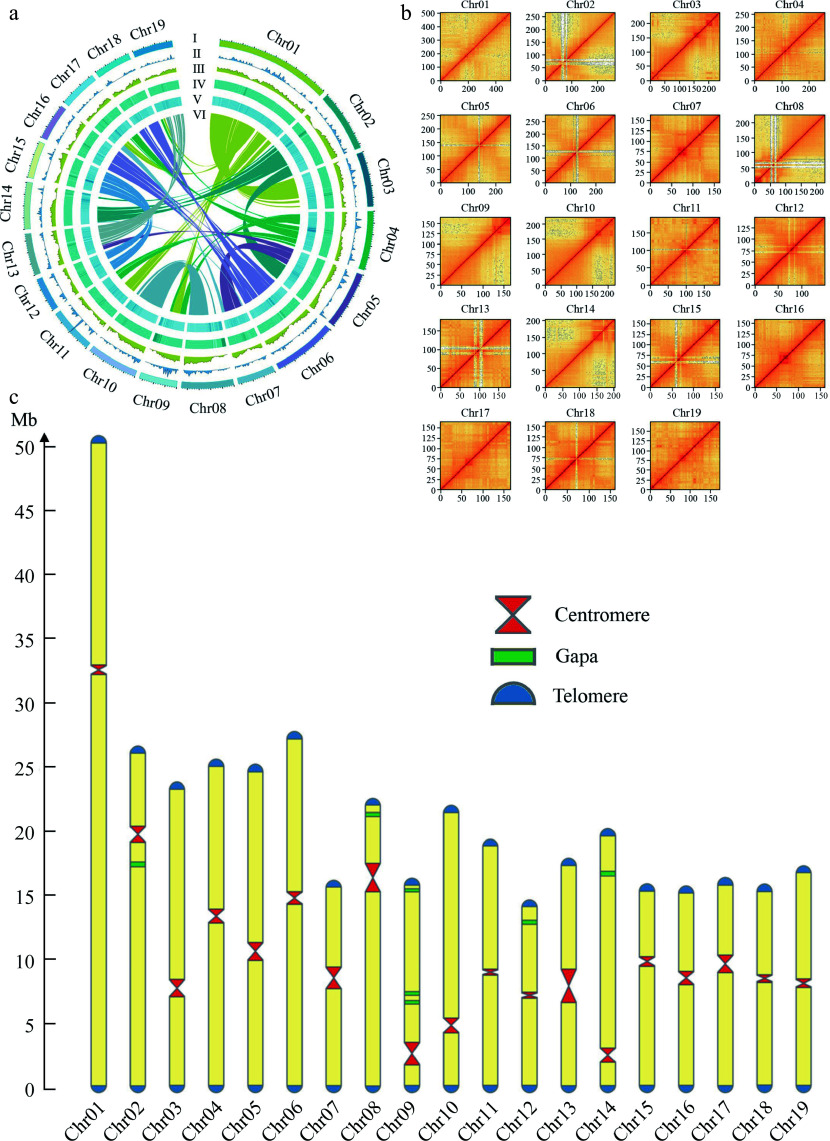
Figure 2.
Chromosomal features of the DH15 genome. (a) Circus diagram of P. ussuriensis DH15 genome. Genome elements are shown in the following scheme (from outer to inner). (I) Chromosome karyotype analysis; (II) Distribution of tRNA (window size, 500 kb); (III) Gene density (window size, 500 kb). (IV) Distribution of GC content (window size, 500 kb); (V) Distribution of transposable element (TE); (VI) Syntenic relationships among different chromosomes of P. ussuriensis. (b) Hi-C interaction heatmap based on the chromosome-scale assembly. The map represents the contact matrices generated by aligning the Hi-C data to the chromosome-scale assembly. Heatmap shows Hi-C interactions under the resolution of 100 kb. (c) Visualization of telomeres, centromeres, and gaps position on chromosomes of P. ussuriensis.

