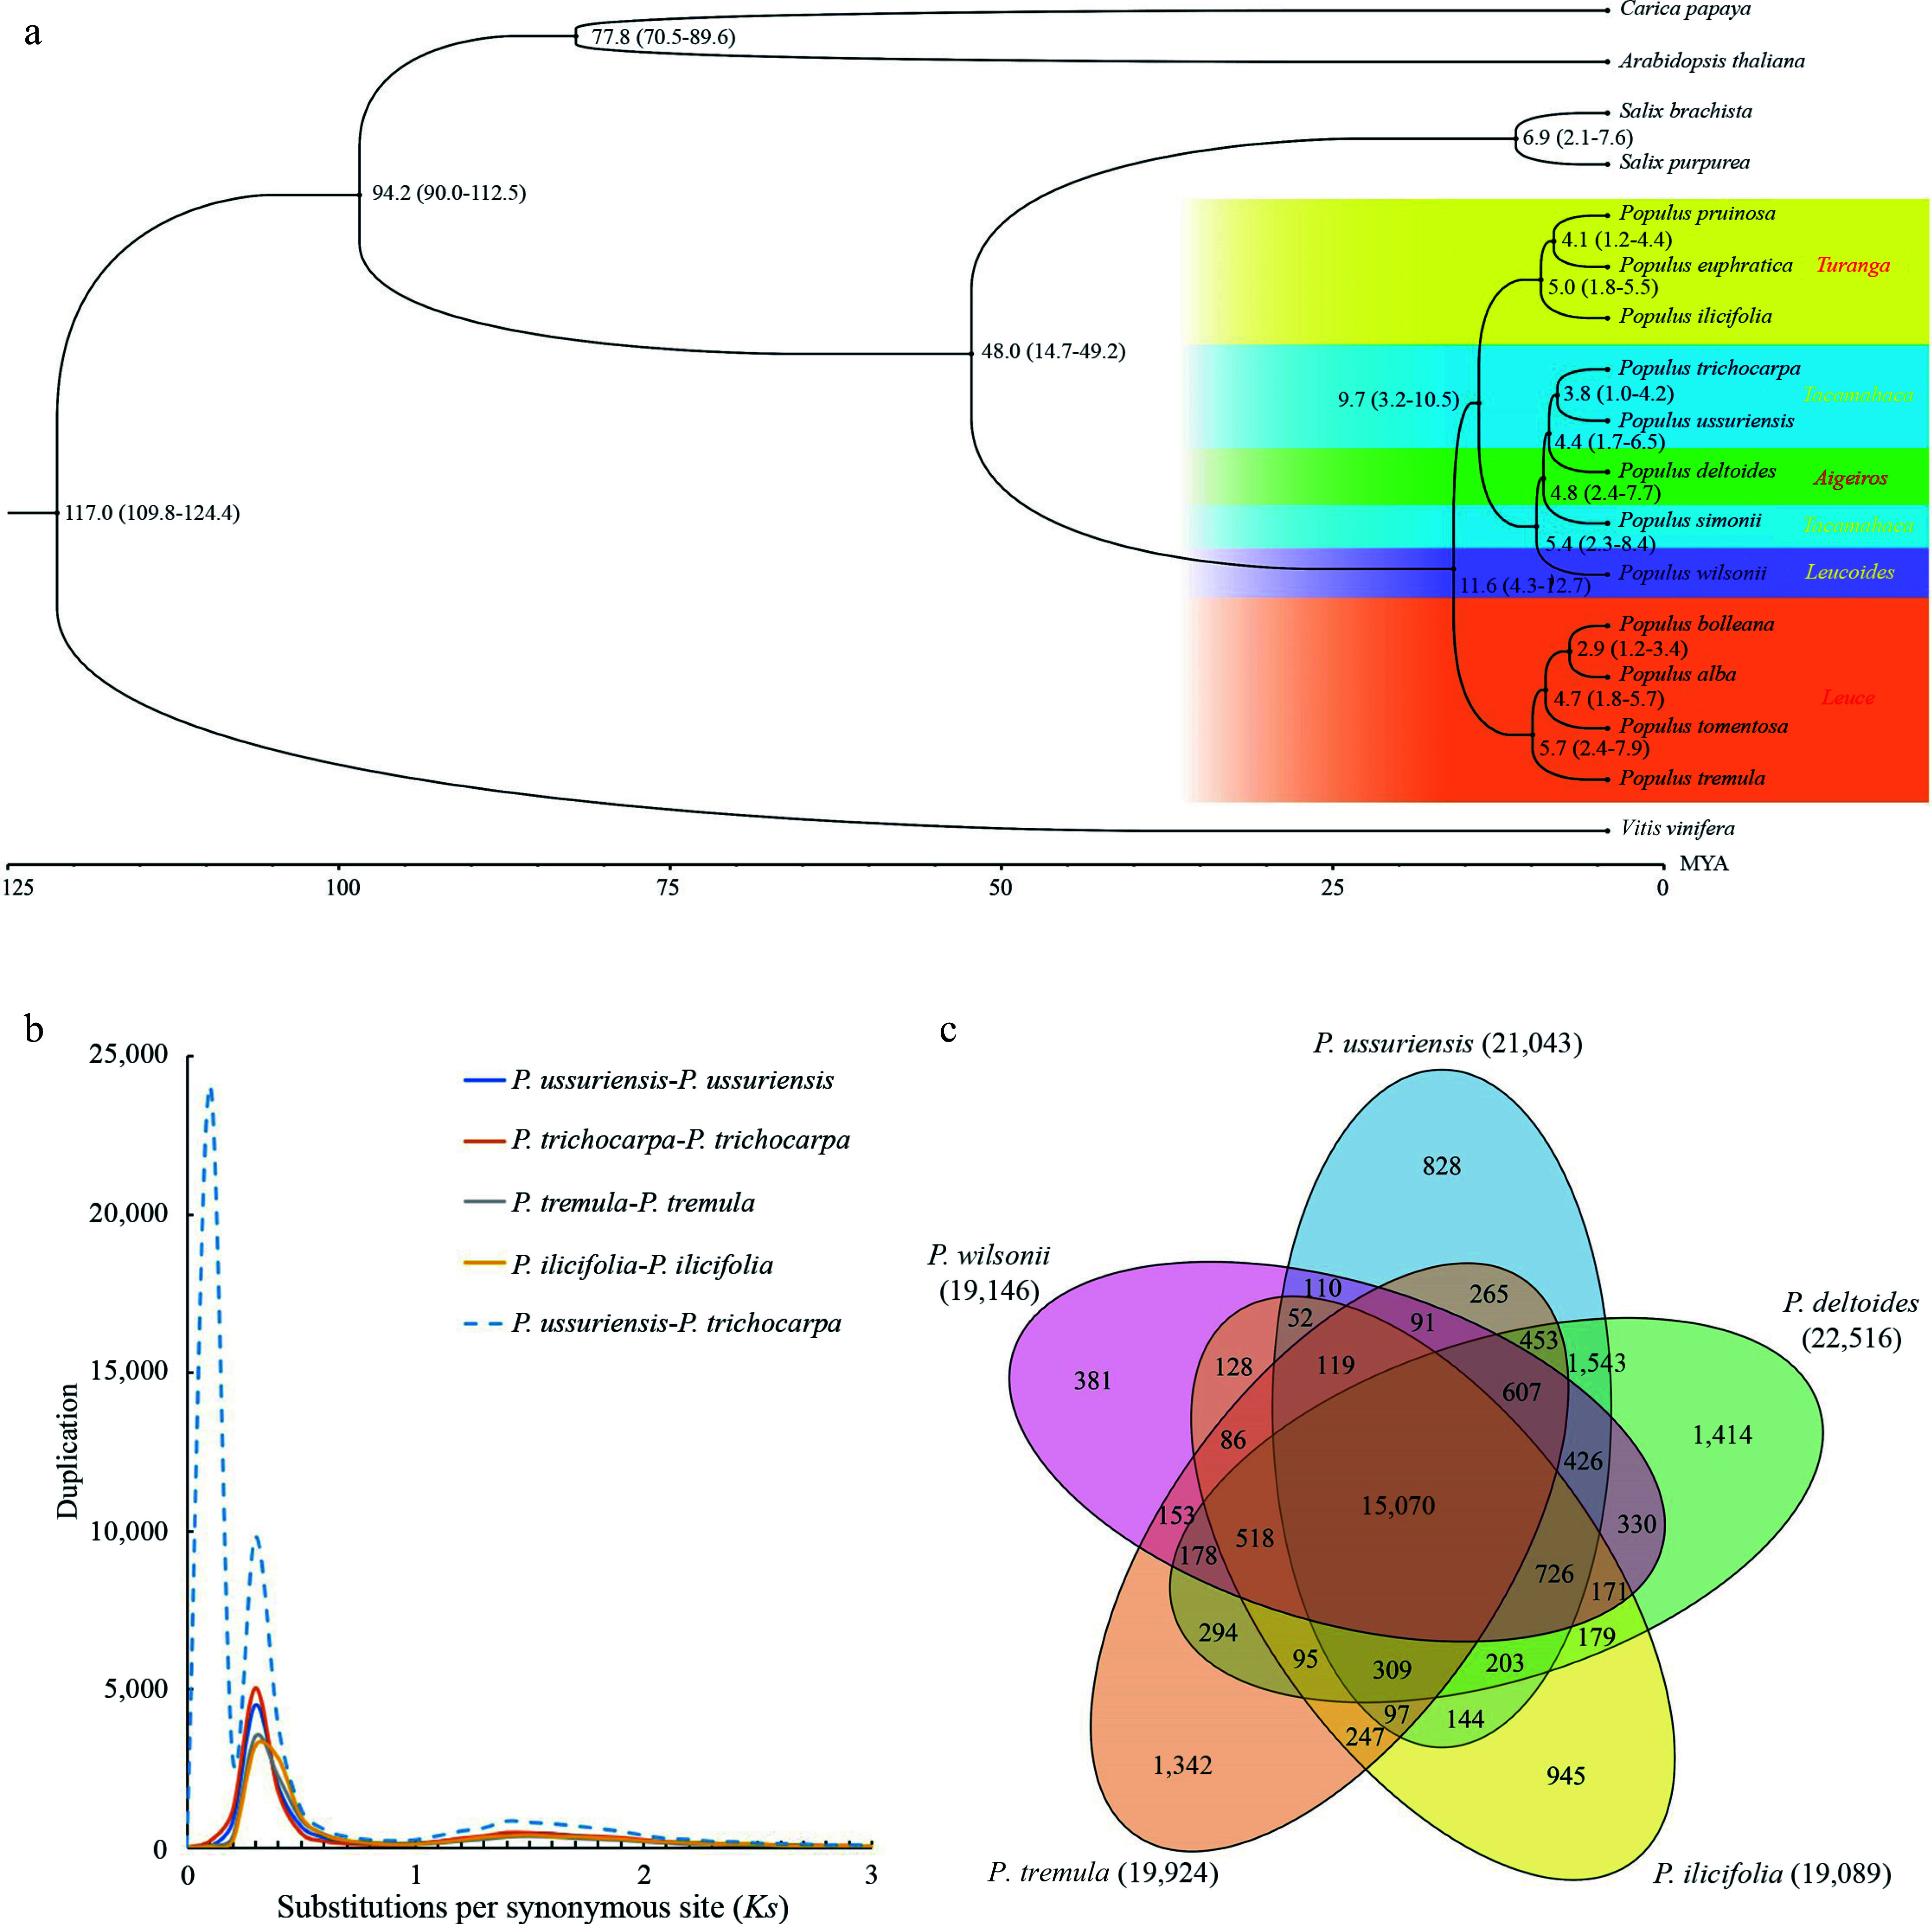
Figure 6.

Evolutionary analysis of the P. ussuriensis genome. (a) Inferred phylogenetic tree of P.ussuriensis and 16 plant species based on protein sequences of single-copy orthologous genes. The numerical value beside each node is the estimated divergent time (million years ago, Mya) while the values in parentheses denote the range of the predicted divergence time). (b) Frequency distributions of synonymous substitutions (Ks) for the paralogous and orthologous genes within each of the following species: P. ussuriensis, P. tremula, P. ilicifolia, P. trichocarpa, and within each species. Additionally, we calculated Ks values between P. ussuriensis and P. trichocarpa. The lines with different colors represent the Ks distribution of different comparisons. (c) Venn diagram of the shared orthologous and paralogous gene families among five species: P. ussuriensis, P. tremula, P. ilicifolia, P. deltoides and P. trichocarpa.
