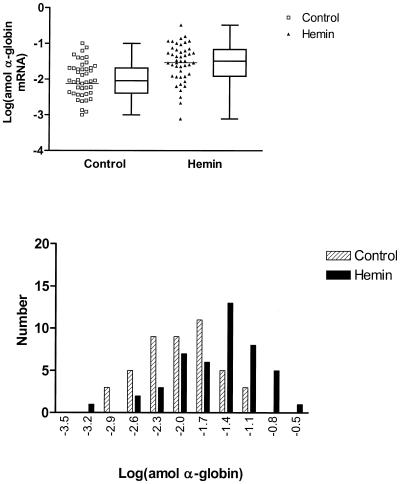
Figure 3.
Logarithmic transformation of α-globin transcript levels in single K562 cells. The upper panel presents plots of transformed data for single-cell expression in control (squares) and hemin-treated (triangles) K562 cells. The bars represent the mean values for logarithm of the globin level which increased from –2.13 to –1.54 (P = 0.0004, t-test), respectively. Concomitantly, the variance declined from 0.90 to 0.28 (P < 0.0001, F-test). Box and whisker plots are presented alongside the scatter plots showing the 25th and 75th percentile and median values for transcript level. Frequency histograms of the transformed data are shown in the lower panel with controls shown as hatched columns and hemin-treated cells as solid columns. The skew in the distributions for the transformed data for control and treated cells is 0.001 (P = 1.00) and –0.690 (P = 0.041), respectively.

