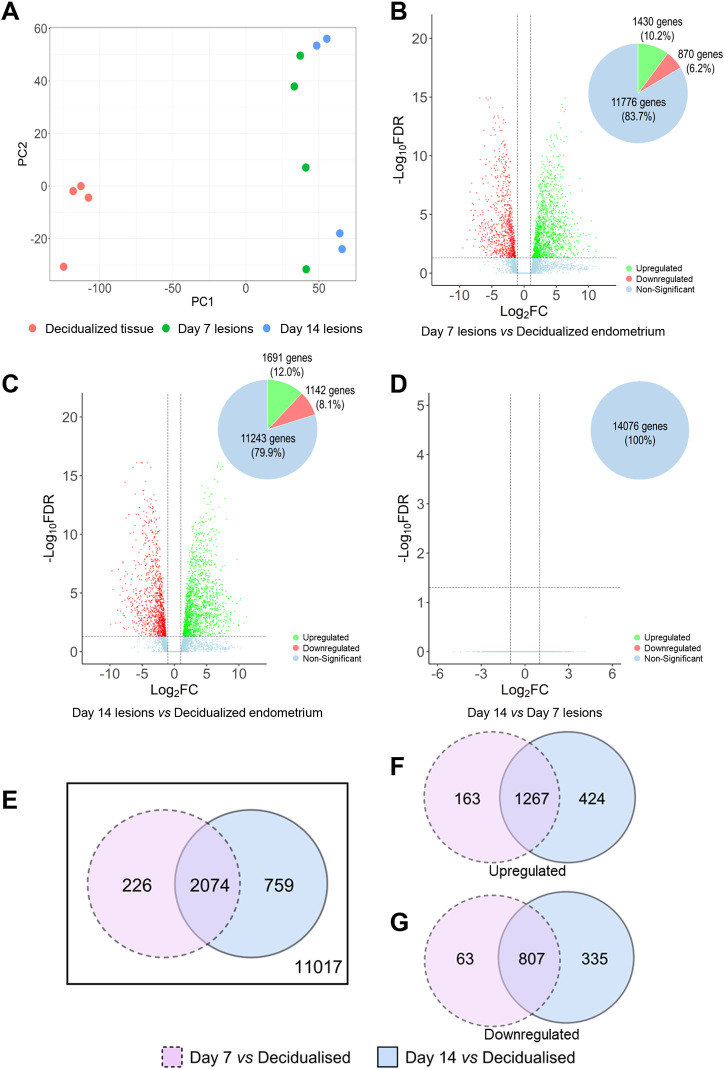
Fig. 2.
Comparison of the gene expression profile in donor decidualized endometrium, and D7 and D14 endometriosis-like lesions. Differentially expressed genes (DEGs) were identified using limma/voom and edgeR with a cut-off of false discovery rate-adjusted P-value (FDR)≤0.05 and log2fold change (log2FC)≥+1 or ≤−1. (A) Principal component (PC) analysis of RNA-seq results visualizing the gene expression pattern of individual samples used in this analysis. (B-D) Volcano plots comparing log10FC and −log10(FDR) among detected genes between D7 lesions versus decidualized endometrium (B), D14 lesions versus decidualized endometrium (C), and D14 lesions versus D7 lesions (D). (E) Venn diagram displays the distribution and overlap of DEGs (both upregulated and downregulated) between D7 lesion versus decidualized endometrium and D14 lesion versus decidualized endometrium. (F,G) Additional Venn diagrams were generated to determine the number of upregulated (F) and downregulated (G) DEGs during lesion development compared to decidualized endometrial tissue. A complete list of DEGs can be found in Tables S1-S3.

