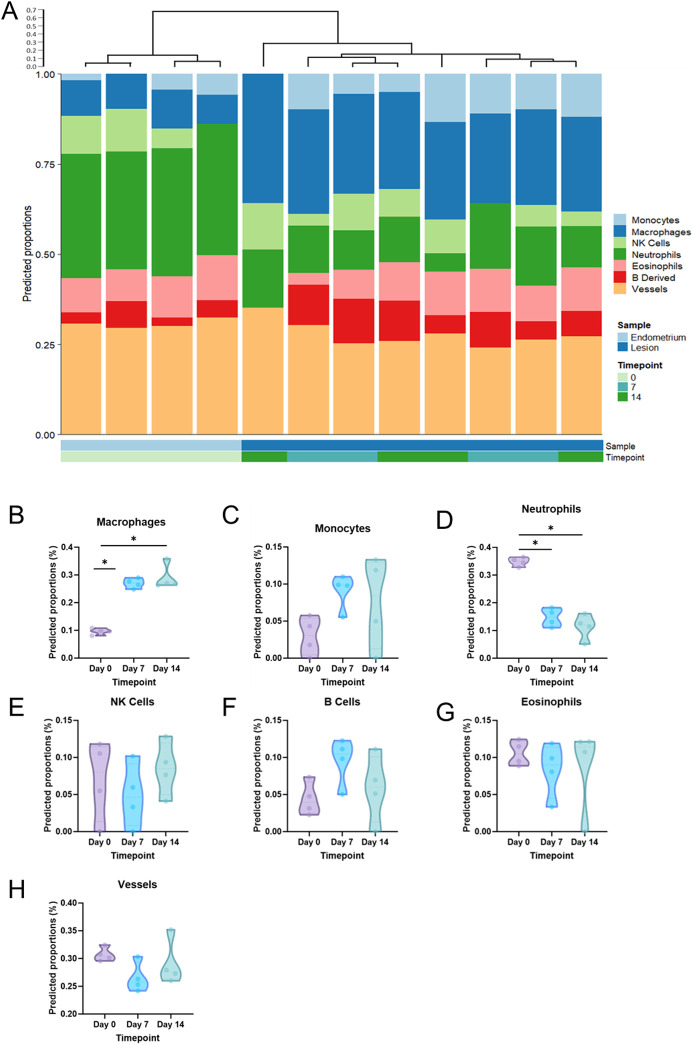
Fig. 3.
Cellular deconvolution of RNA-seq data. (A) Cellular deconvolution with Euclidean clustering was performed for each of the 12 tissue samples. (B-H) Predicted proportions of macrophages (B), monocytes (C), neutrophils (D), natural killer (NK) cells (E), B cells (F), eosinophils (G) and vessels (H) were compared across the three timepoints (D0, decidualized endometrium; D7, Day 7 lesions; D14, Day 14 lesions). Effect of tissue status was analyzed by Mann–Whitney test (*P<0.05).

