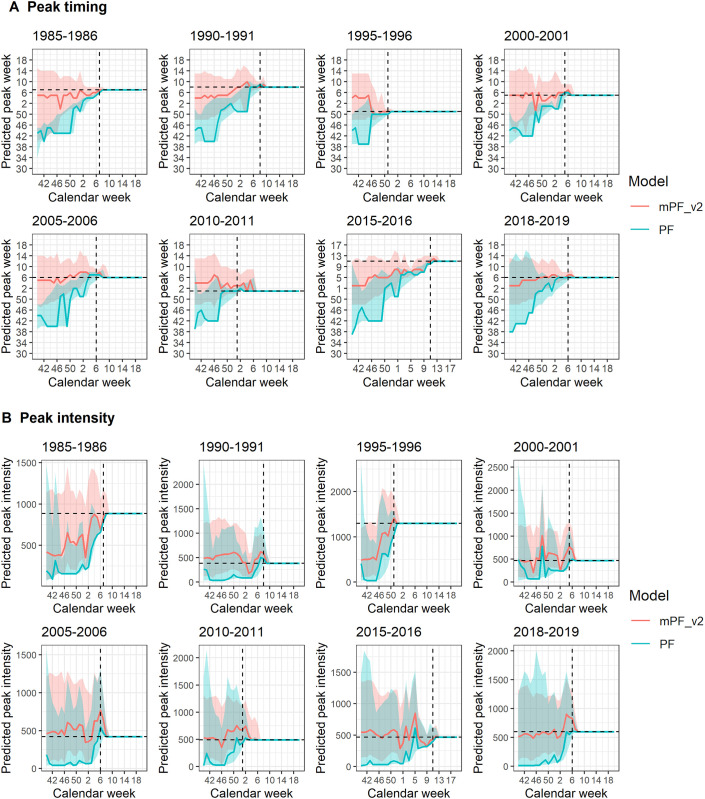
Fig 3. Predicted peak timing (A) and peak intensity (B) for the 8 test seasons, for the modified particle filter (mPF_v2) and the standard bootstrap particle filter (PF).
Solid lines represent projection medians, light shaded areas represent 95% prediction intervals, and dashed lines represent the true values.

