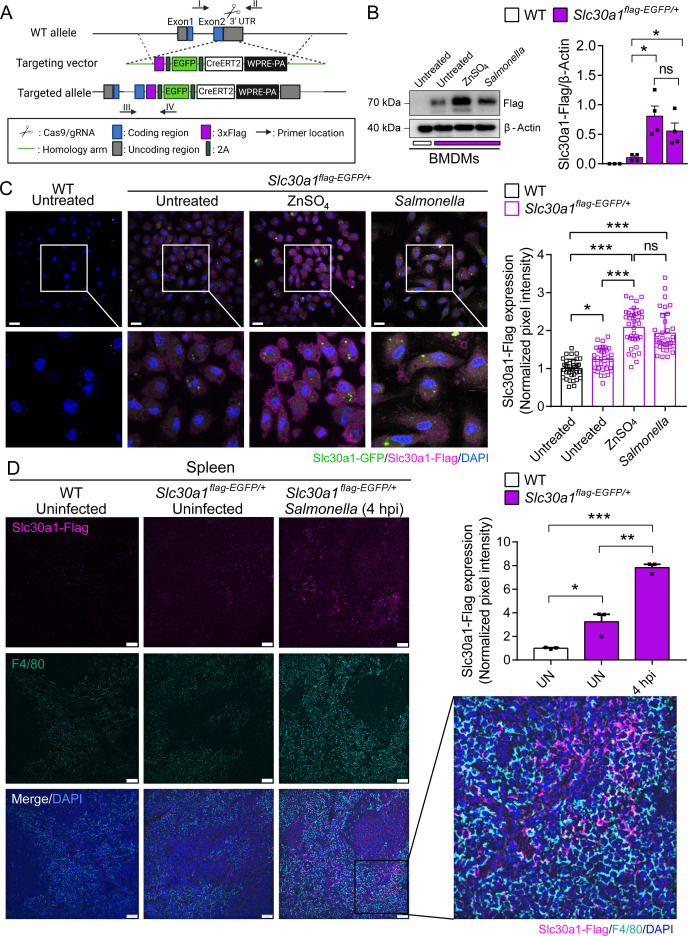
Figure 2. Characterization of a Slc30a1 reporter mouse with or without Salmonella infection.
(A) Strategy for generating an Slc30a1 reporter mouse line expressing 3xFlag-EGFP under the control of the endogenous Slc30a1 promotor (Slc30a1flag-EGFP/+). (B) Western blot analysis of Slc30a1-flag in bone marrow-derived macrophages (BMDMs) isolated from Slc30a1flag-EGFP/+mice and exposed to ZnSO4 treatment (40 µM) or Salmonella (multiplicity of infection [MOI] = 1) for 4 hr. (C) Confocal fluorescence images of BMDMs treated as shown in B and immunostained using an anti-flag antibody (magenta); the nuclei were counterstained with DAPI(4′,6-diamidino-2-phenylindole) (blue), and GFP(Green fluorescent protein) was visualized directly based on green fluorescence. Scale bars, 20 µm. Shown at the right is the summary of the normalized pixel intensity of Slc30a1-flag expression in BMDMs in each group. (D) Confocal fluorescence images of spleen samples obtained from a Salmonella-infected mouse at 4 hpi; also shown are samples of uninfected WT and Slc30a1flag-EGFP/+ mice. The samples were stained with anti-flag (magenta) and anti-F4/80 (cyan), and the nuclei were counterstained with DAPI (blue). Scale bars, 50 µm. Shown at the right is the summary of the normalized pixel intensity of Slc30a1-flag expression in the spleen in each group. Data are presented as mean ± SEM(Standard Error of the Mean). p values were determined using two-tailed unpaired Student’s t-test. *p < 0.05, **p < 0.01, ***p < 0.001, and ns, not significant.

