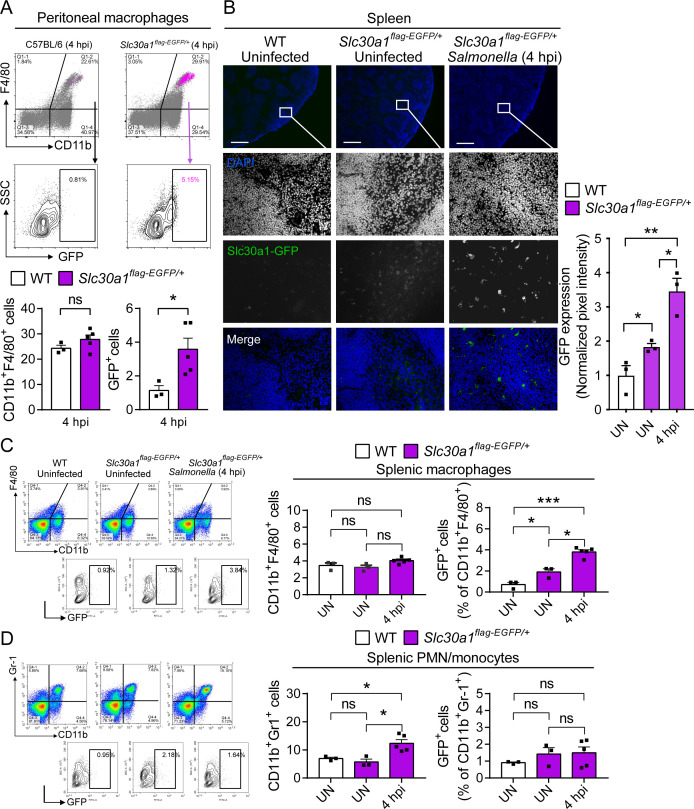
Figure 3. Induction of Slc30a1 expression in macrophages of a Slc30a1 reporter mouse upon Salmonella infection.
(A) FACS(Fluorescence-activated cell sorting) plots of GFP expression in CD11b+F4/80+ macrophages isolated from the peritoneal cavity of Salmonella-infected WT mice and Salmonella-infected Slc30a1flag-EGFP/+ mice at 4 hpi (n = 3–5 mice/group). (B) Fluorescence microscopy images of spleen samples obtained from a Salmonella-infected mouse at 4 hpi; also shown are samples of uninfected WT and Slc30a1flag-EGFP/+ mice. The green region indicated the Slc30a1-GFP expression, and the blue region indicated the nuclei staining by DAPI. Scale bar, 500 μm. FACS plots of GFP expression in CD11b+F4/80+ splenic macrophages (C) and CD11b+Gr-1+ splenic PMN/monocyte (D) isolated from the spleens of uninfected WT mice, uninfected Slc30a1flag-EGFP/+ mice, and Salmonella-infected Slc30a1flag-EGFP/+ mice at 4 hpi (n = 3–5 mice/group). Shown at the right is the summary of the percentage of CD11b+F4/80+ splenic macrophages and CD11b+Gr-1+ splenic PMN/monocyte in each group. Data in this figure are represented as mean ± SEM. p values were determined using two-tailed unpaired Student’s t-test. *p < 0.05, **p < 0.01, ***p < 0.001, and ns, not significant.


