. 2024 Oct 30;13:e89509. doi: 10.7554/eLife.89509

Figure 4. Lyz2-Cre-driven Slc30a1 conditional knockout mice are highly susceptible to Salmonella infection.

(A) Strategy for generating floxed Slc30a1 mice. Crossing this mouse with a heterozygous Lyz2-Cre mouse produces Slc30a1fl/fl;Lyz2-Cre and Slc30a1fl/fl littermates. (B) RT-qPCR analysis of relative Slc30a1 mRNA levels in bone marrow-derived macrophages (BMDMs) isolated from Slc30a1fl/fl;Lyz2-Cre and Slc30a1fl/fl mice (n = 5). (C) Kaplan–Meier survival curve of Salmonella-infected mice (n = 14–15 mice/group). (D, E) Gross and hematoxylin and eosin (H&E)-stained images of spleen and liver obtained from Salmonella-infected mice at 24 hpi. Scale bars, 1 cm, 5 mm and 10 mm, respectively. (F) FACS plots (left) and summary (right) of CD11b+F4/80+ peritoneal macrophages obtained from Salmonella-infected mice at 4, 24, and 48 hpi (n = 5–10 mice/group). (G) Summary of Salmonella CFUs measured in the peritoneal fluid, blood, spleen, and liver of Salmonella-infected mice at 4, 24, and 48 hpi (n = 3–5 mice/group). Data in this figure are represented as mean ± SEM. p values of survival in D were determined using Log-rank test, in B and F–K using two-tailed unpaired Student’s t-test. *p < 0.05, **p < 0.01, ***p < 0.001, and ns, not significant.

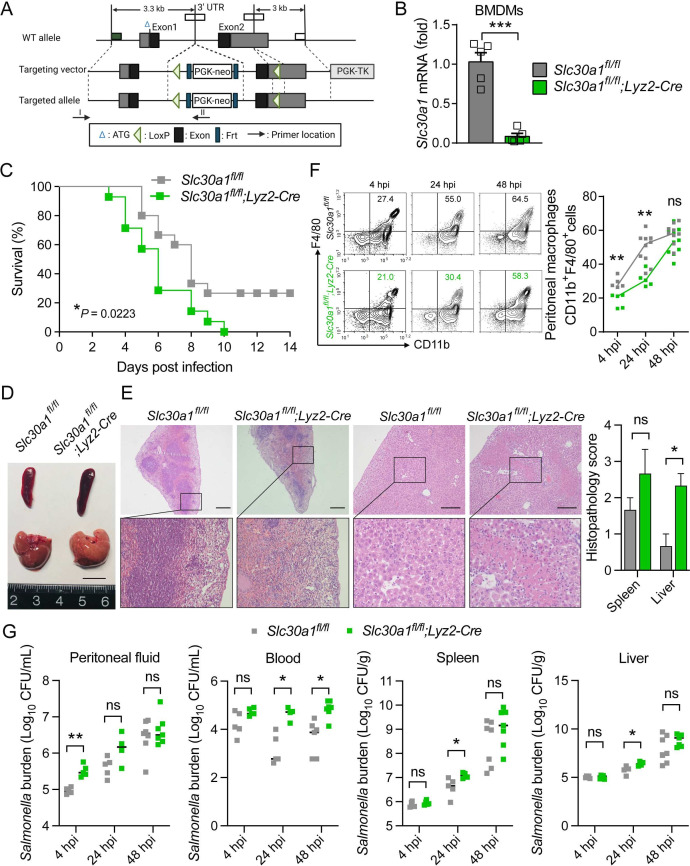
Figure 4.

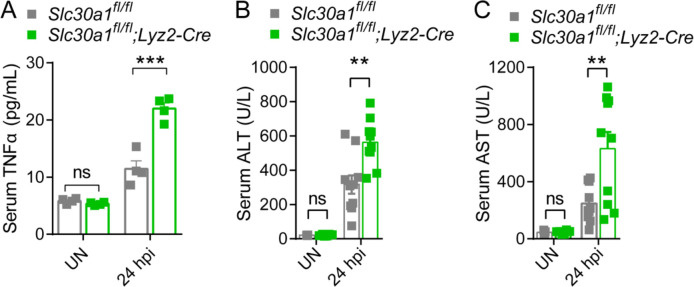
Figure 4—figure supplement 1. Elevated levels of proinflammatory cytokine and injury markers in the serum of Slc30a1fl/fl;Lyz2-Cre mice.

Figure 4—figure supplement 1.

(A) Serum TNFα, (B) ALT, and (C) AST were measured in uninfected (UN) and Salmonella-infected mice at 24 hpi (n = 4-10 mice/group). Data are represented as mean ± SEM. P values were determined using 2-tailed unpaired Student’s t-test. *P<0.05 and ns, not significant.
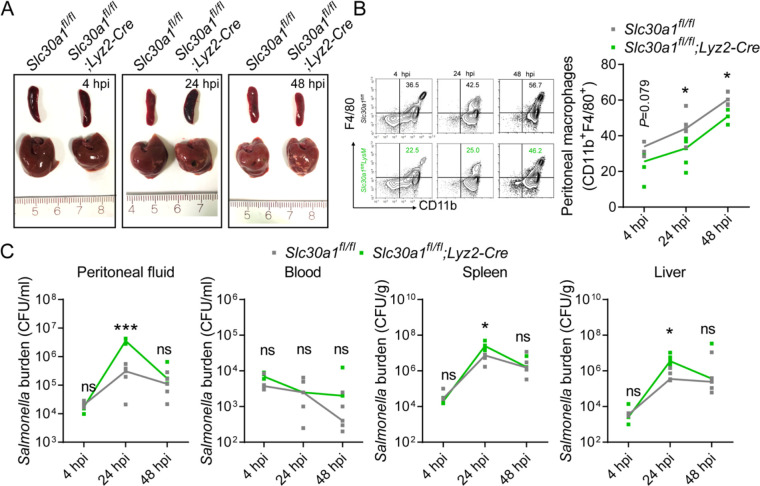
Figure 4—figure supplement 2. Salmonella infection leads to significantly decreased macrophages and increased tissue bacterial burden in Slc30a1fl/fl;Lyz2-Cre mice.

Figure 4—figure supplement 2.

(A) Gross image of spleen and liver of mice after infection with a non-lethal dose of Salmonella (1x10⁴ CFU/mouse) 4, 24, and 48 hpi. Scale bars, 1 cm. (B) FACS plots of CD11b+F4/80+ peritoneal macrophages obtained from Salmonella-infected Slc30a1fl/fl and Slc30a1fl/fl;Lyz2-Cre mice (n = 3-5 mice/group). (C) Bacterial burden (in CFU/ml) measured in the peritoneal fluid, blood, spleen, and liver of Salmonellainfected Slc30a1fl/fl and Slc30a1fl/fl;Lyz2-Cre mice (n = 3-5 mice/group). Data are represented as mean ± SEM. P values were determined using 2-tailed unpaired Student’s t-test. *P<0.05, ***P<0.001, and ns, not significant.