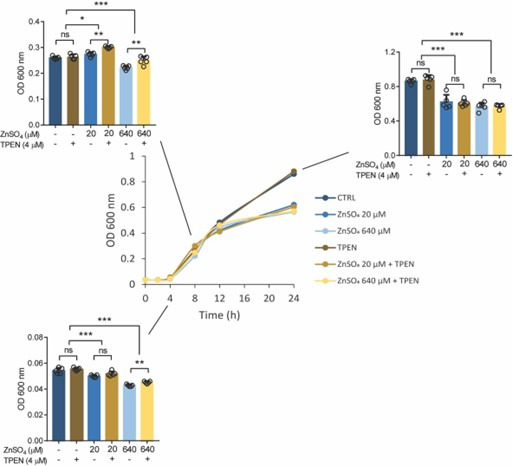
Author response image 2. Growth curve (optical density, OD 600 nm) of Salmonella in LB medium at different concentrations of ZnSO4 and/or TPEN.

Bar graph indicating Salmonella growth at specific time points. Each value was expressed as mean of triplicates for each testing and data were determined using 2-tailed unpaired Student’s t-test. *P<0.05, **P<0.01, ***P<0.001 and ns, not significant.
