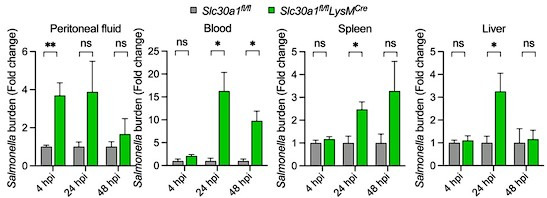
Author response image 3. Bar graph indicates fold change in Salmonella burden of Slc30a1fl/flLysMCre normalized to Slc30a1fl/fl.

Data are represented as mean ± SEM. P values were determined using 2-tailed unpaired Student’s t-test. *P<0.05, ***P<0.001, and ns, not significant.
