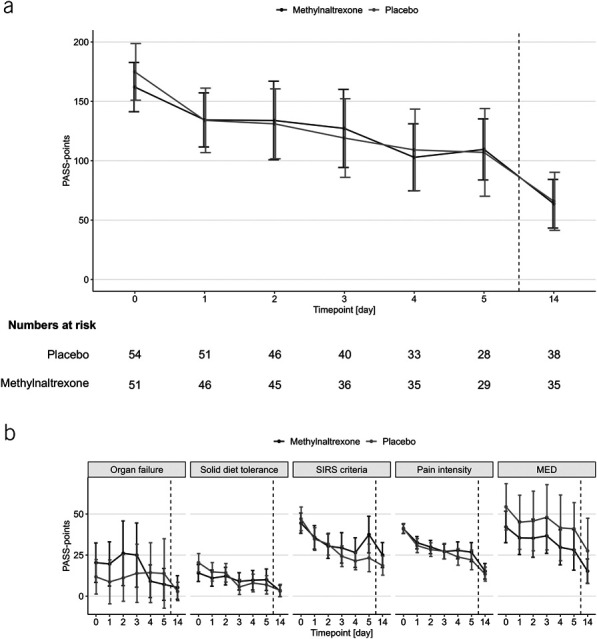
Figure 2.

PASS scores in the intention-to-treat population. Line graphs show means and 95% CIs (whiskers) of daily PASS scores (a) and PASS points within the 5 scoring elements (b). Data are shown for the intention-to-treat population. Missing data were imputed using the multiple imputation approach. The dashed lines separate the end of treatment and follow-up on day 14. CI, confidence interval; MED, morphine equivalent doses; PASS, Pancreatitis Activity Scoring System; SIRS, systemic inflammatory response syndrome.
