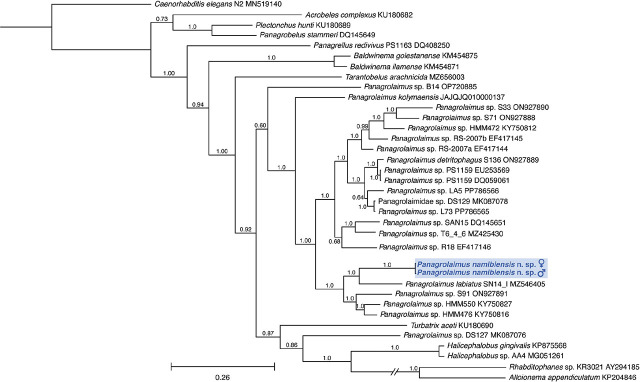
Figure 6:
Phylogenetic tree inferred by Bayesian analysis of LSU sequences showing the relationship of Panagrolaimus namibiensis n. sp. (highlighted in blue) to other members of Panagrolaimidae and other taxa. Support for internal clades is shown by posterior probability (pp) values placed next to nodes supported by greater than 0.5 pp. Scale bar represents 0.26 estimated substitutions per site.

