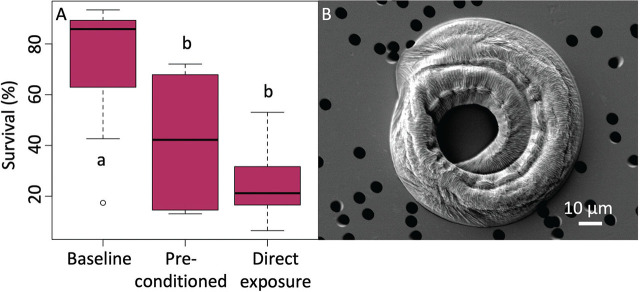
Figure 7:
A) Panagrolaimus namibiensis n. sp. survival (% of population regaining motility) after exposure to three treatments. Baseline nematodes were maintained at 100% RH for 24 h. Pre-conditioned nematodes were slowly exposed to increasingly lower RH levels before 24 h at 0%. Direct exposure nematodes were directly exposed to 0% RH. Boxplots represent the interquartile range with lines representing the median value. Whiskers represent the minimum/maximum values, and circles are outliers. N = 8 replicates per treatment. Bars with different lowercase letters are statistically different from each other (Tukey’s HSD test). B) SEM of a coiled and anhydrobiotic P. namibiensis n. sp.

