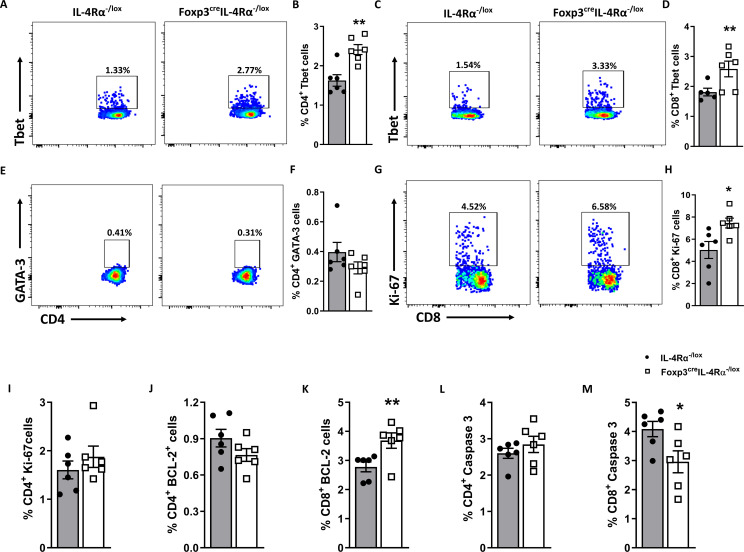
Figure 6.
Splenic CD8 T cells expand and express higher Tbet in Foxp3creIL-4Rα−/lox mice duirng L. monocytogenes infection. A single-cell suspension of splenocytes was stained for intranuclear transcription factors T-bet and GATA-3 from mice euthanized at 7 dpi. Representative flow plots and frequencies of T-bet+ in (A, B) CD4 and (C, D) CD8 T-cell populations. (E, F) Representative flow plots and frequencies of GATA-3+ CD4 T cells. (G, H) Representative flow plots and frequencies of Ki-67+ CD8 and (I) Ki-67+CD4 T cells. (J, K) BCL-2+ CD4 and CD8 T cells and (L, M) Caspase 3+ CD4 and CD8 T cells are shown. Grey bars represent IL-4Rα−/lox mice, and white bars represent Foxp3creIL-4Rα−/lox mice. Data are represented as mean ± SEM of n = 6–8 mice/time point from two independent experiments, analysed using a two-tailed unpaired Student’s t-test (* p <0.05; ** p <0.01).

