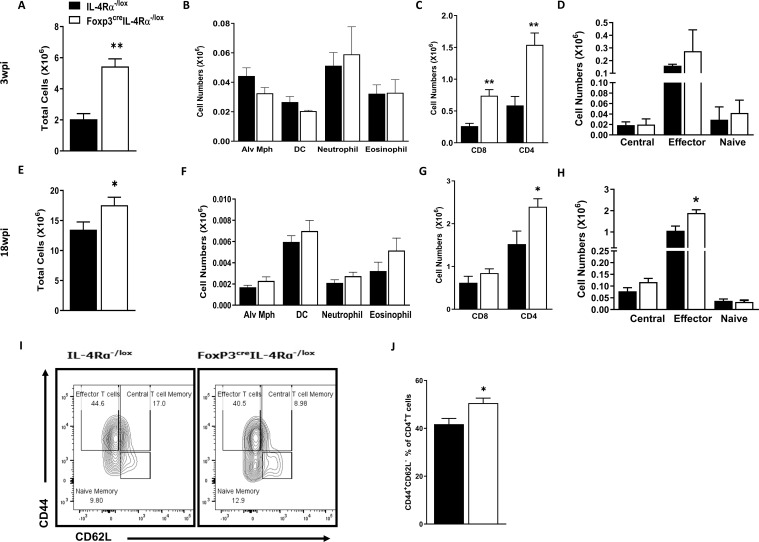
Figure 8.
Increased T effector cells in the lungs during acute and chronic M. tuberculosis infection in Foxp3creIL-4Rα−/lox mice. Lung single-cell suspensions were prepared to determine myeloid and lymphoid populations at 3 and 18 weeks postinfection. (A, E) Total lung cell numbers; (B, F) Myeloid populations (alveolar macrophages, dendritic cells, neutrophils, and eosinophils); (C, G) CD4 and CD8 T cells; (D, H) CD4 T effector, naïve, and central cell numbers; (I) Representative flow plot of CD4 T effector, naïve, and central memory cells; and (J) Percentage of effector CD4 T cells. Data are represented as mean ± SEM of n = 5–6 mice/time, representative of two independent experiments, and analysed using the unpaired Student’s t-test (* p < 0.05; ** p < 0.01).

