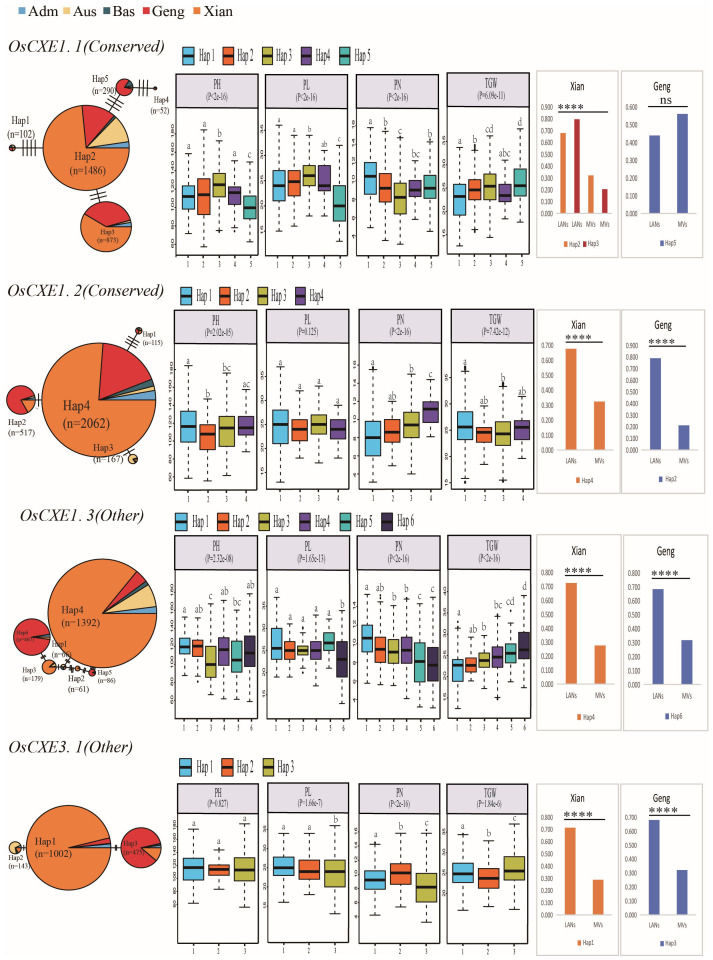
Figure 10.
Haplotype network analysis of OsCXE genes and their associations with four agronomic traits in 3KRG.P-values under the trait names indicate differences between haplotypes assessed by a two-factor ANOVA, where different letters on the boxplot indicate statistically significant differences at P< 0.05 based on Duncan’s multiple range test. The bar chart on the right shows the difference in frequency of dominant gcHaps between local varieties (LANs) and modern varieties (MVs) of Xian and Geng. Chi-square tests were used to determine significant differences in the proportion of the same gcHap between different populations ****P<0.0001, ***P<0.001, **P<0.01, *P<0.05 and N.S., not significant.

