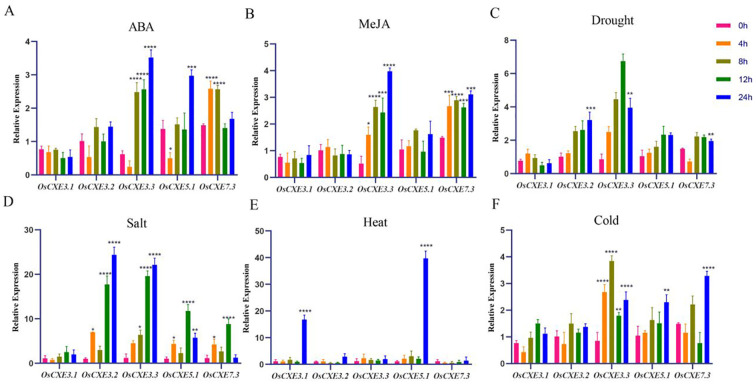
Figure 8.
Analysis of expression levels of five genes of the OsCXE (Nipponbare) family under different treatments. (A) ABA treatment. (B) MeJA treatment. (C) Drought stress. (D) NaCl stress. (E) High temperature stress. (F) Low temperature stress. Statistical analysis of the data was performed using WPS2023 software, and IBM SPSS Statistics 25 statistics analysis software was used to perform analysis of variance; the significance level was defined as **** p < 0.0001, *** p < 0.001, ** p < 0.01, * p < 0.05.

