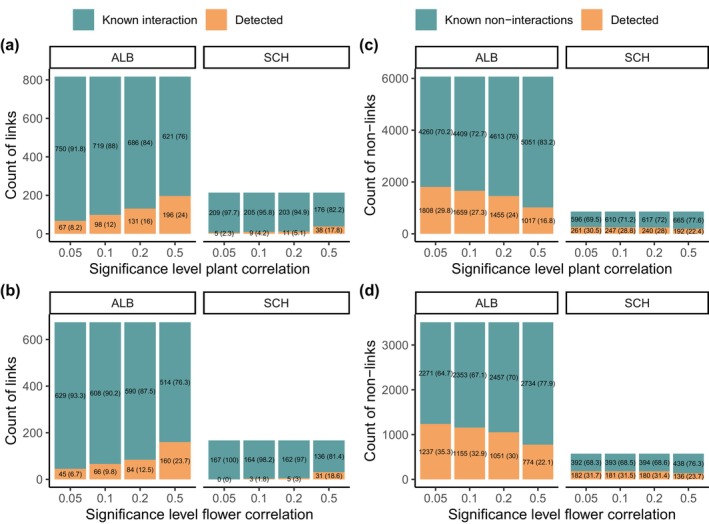
FIGURE 2.

Sensitivity (a, b) and specificity (c, d) per region at different significance values of the Spearman's rank correlation method for the abundance of lepidopteran species with the abundance of plants (a and c) and flowers (b and d) at different significance levels. Sensitivity was transformed to a percentage and appears in parentheses within the “detected” orange bar (blue/green bars represent the undetected known interactions). Sensitivity represents the probability of detecting a true link and was calculated as TP/(TP + FN). Known links are any values > 0 in the interaction matrix. Specificity was transformed to percentage and appears in parentheses within the “detected” orange bar (blue/green bars represent the undetected known non‐interactions). It was defined as the true negative rate and was calculated as TN/(TN + FP). Known non‐links are the 0 s in the interactions matrix. Abbreviations: ALB = region Swabian Jura; FN = false negatives; FP = false positives; Plant, and Flower correlation = Spearman's rank correlation of plants and flowers with Benjamini–Hochberg's multiple testing correction; Probabilistic = probabilistic method (Veech 2013); RII null models = Relative Interaction Intensity index with pairwise null models (Armas, Ordiales, and Pugnaire 2004); SCH = region Schorfheide‐Chorin; TN = true negatives; TP = true positives.
