
Fig. 2. Behavioral performance on the MEG perceptual feature matching task.
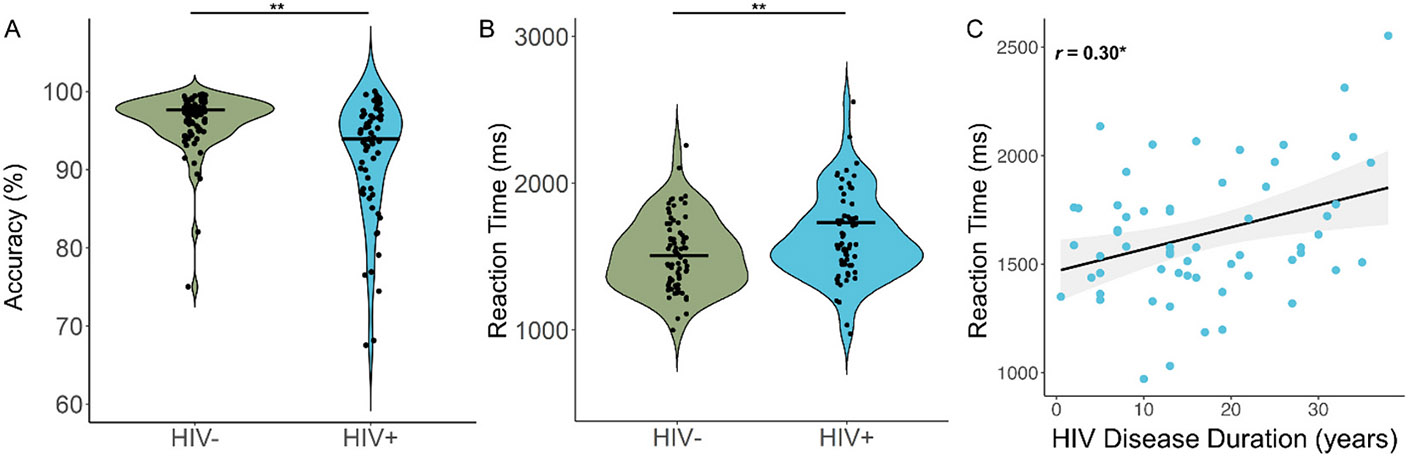
People with HIV (PWH) were less accurate (A) and responded slower (B) on the perceptual feature matching task compared to controls. Accuracy, expressed as the percent correct, appears on the y-axis of (A) and reaction time, in ms, is displayed on the y-axis of (B), with group on the x-axes of both panels. Violin plots show the probability density per group, with the black bars indicating the group means. (C) Reaction time (y-axis) was also significantly correlated with HIV disease duration in PWH, with longer HIV disease durations (in years, x-axis) being associated with slower reaction times, controlling for the effect of age. The gray shading surrounding the trendline represents the standard error of the mean. **p < .01, *p < .05.