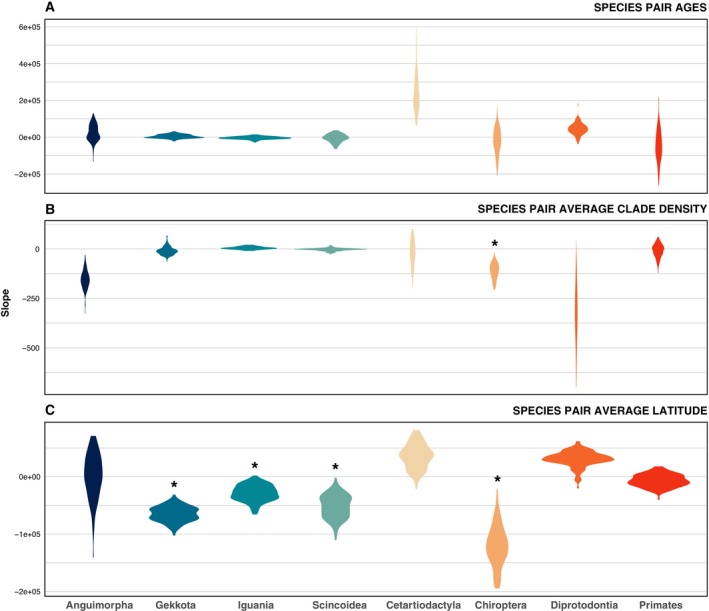
FIGURE 3.

Slopes of the tested relationships between species pairs' age, average clade density, and absolute latitude and species pairs' distance. (A) Slopes for the relationship between species pair age and geographical distance. (B) Slopes for correlations between species pair average clade density and their geographical distance. (C) Slopes for the relationship between the species pair absolute average latitude and their geographical distance. The range of values represented corresponds to the phylogenetic uncertainty. Asterisks correspond to statistically significant relations.
