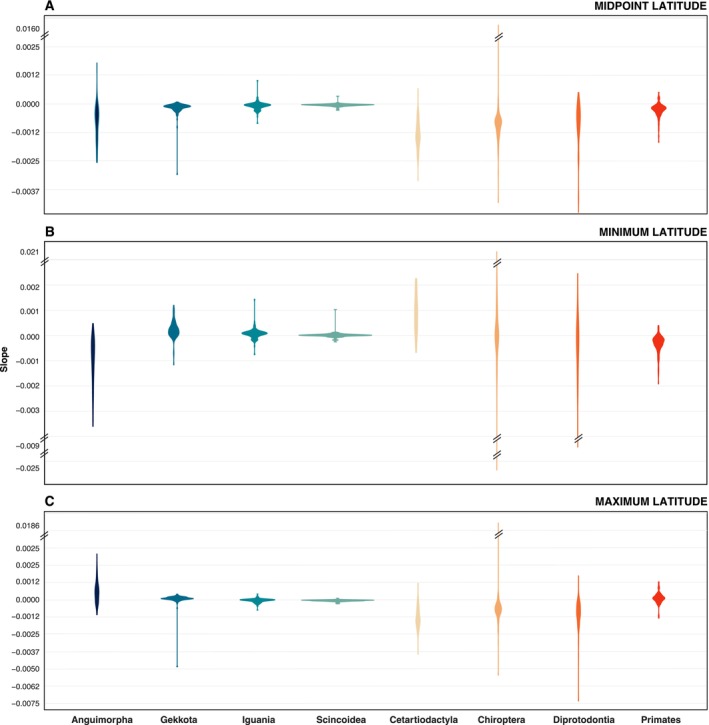
FIGURE 4.

Slopes of the tested relationships between species clade density, and the evolutionary rate of geographic range metrics. Relationships are presented between clade density and the evolutionary rate of midpoint (A), minimum (B), and maximum latitude (C). The range of values represented corresponds to the phylogenetic uncertainty. Asterisks correspond to statistically significant relations (none are shown).
