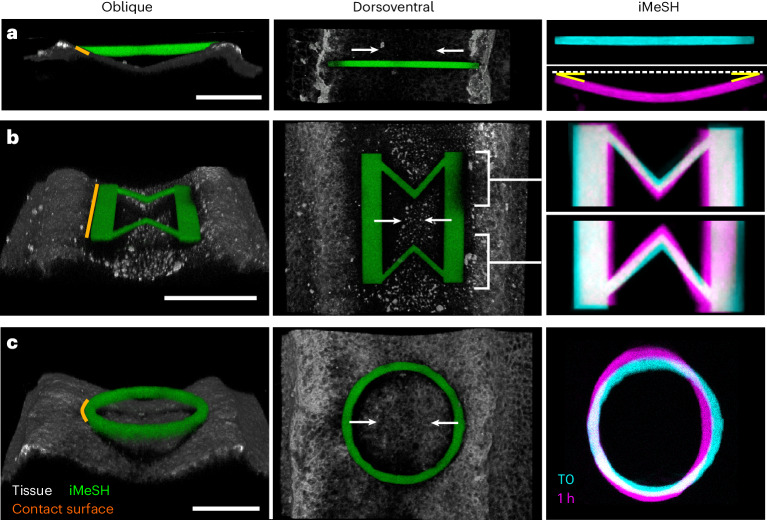
Fig. 2. Optimization of force sensor shapes to quantify morphogenetic forces.
a–c, Oblique and dorsoventral 3D reconstructions of a horizontal bar (a), a double V-shaped spring (b) and a cylinder (c), iMeSH shapes printed between chick embryo neural folds. Overlaid initial (T0) and deformed (at 1 h) geometries are shown. Orange lines show tissue contacts along which force is applied; white arrows indicate the direction of neural fold apposition; and yellow angles indicate highly symmetrical deformation. Scale bars, 100 µm.

