
Extended Data Fig. 7. Assessing phenotypic similarity between patients with biallelic genotypes in the same gene.
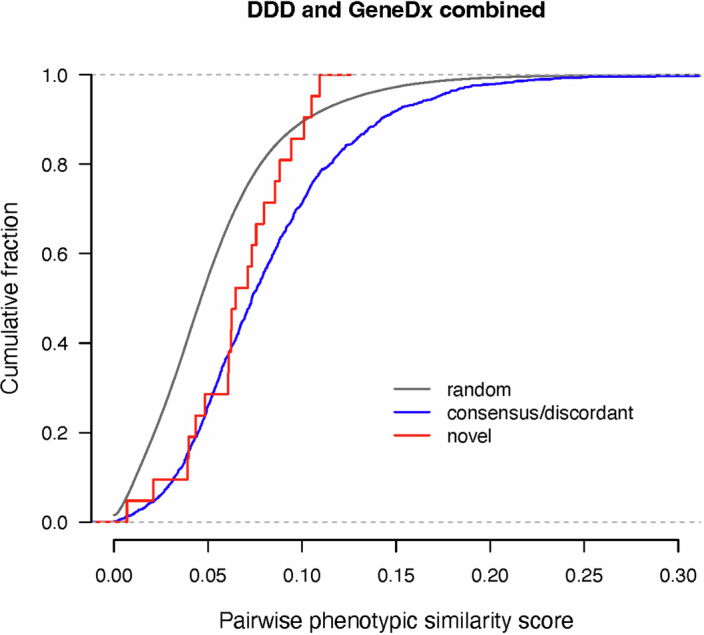
Cumulative distribution functions for pairwise phenotypic similarity scores as calculated by Phenopy. The distribution of novel genes passing FDR < 5% (ATAD2B, CRELD1, HECTD4, KBTBD2, ZDHHC16) is shown in red, consensus/discordant genes passing FDR < 5% in blue, and the similarity scores of random pairs in grey. Random pairs were selected proportionally to match the occurrence of DDD/DDD, GeneDx/GeneDx and DDD/GeneDx pairs in the novel and consensus/discordant sets. The phenotypic similarity scores in patients with damaging biallelic genotypes in the novel genes were not significantly lower than those for patients with such genotypes in consensus/discordant genes (one-sided Wilcoxon rank sum p = 0.12), but they were significantly higher than random scores (one-sided Wilcoxon rank sum p = 0.0058).