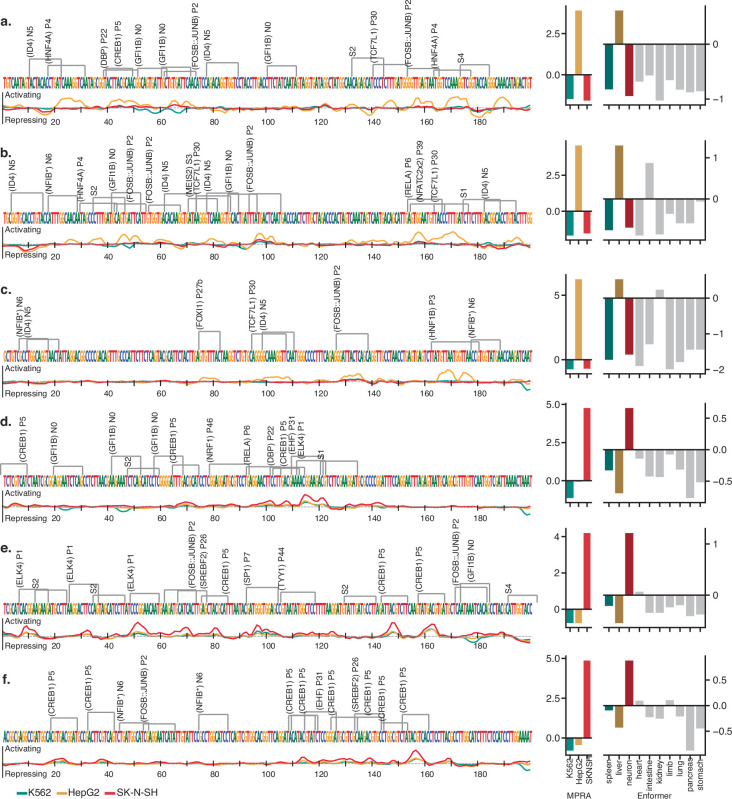
Extended Data Fig. 9. Malinois contribution scores/Enformer/MPRA results for in vivo sequences.
Collection of synthetic sequences prioritized for in vivo validation. Sequences in panels (a-c) and (d-f) are expected to drive expression in liver and neurons, respectively. Left column: Nucleotide sequence, motif matches, and contribution score tracks for each candidate. Right column: Bar plots of empirical MPRA signal (left y-axis) in K562 (teal), HepG2 (gold), and SK-N-SH (red) as well as aggregated Enformer predictions (right y-axis) of epigenetic signals reflecting transcriptional activation in mouse spleen (dim teal), liver (dim gold), neural tissue (dim red), heart, intestine, kidney, limb buds, lung, pancreas, and stomach.

