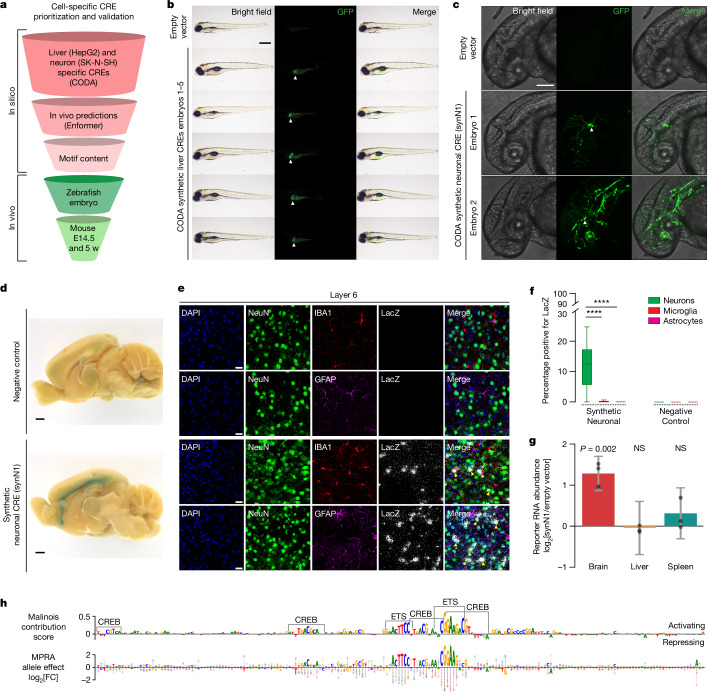
Fig. 4. In vivo validation of synthetic elements.
a, Synthetic CREs in vivo validation prioritization. b, CODA-designed HepG2-cell-specific CRE activity imaging in transgenic zebrafish at 96 h after fertilization. Lateral view, anterior on the left, dorsal up. The liver is indicated by white arrows. Liver expression was observed in 27 out of 36 animals (Supplementary Fig. 18). Scale bar, 500 μm. c, CODA-designed SK-N-SH-cell-specific CRE activity imaging in transgenic zebrafish at 48 h after fertilization. Lateral view of the brain and anterior spinal region, anterior left, dorsal up. The white arrows indicate GFP-positive neuronal cells. Embryo 2 shows incidental off-target vasculature expression. Neural staining was replicated in an additional animal. Scale bar, 125 μm. d, Synthetic SK-N-SH-cell-specific CRE (synN1) activity in 5-week-old postnatal mice measured by X-gal staining for LacZ in the medial brain section. Cortical X-gal signal was detected in n = 0 out 5 negative controls and n = 3 out of 6 synN1s. Scale bars, 1 mm. e, CRE activity (LacZ) in neocortex layer 6 with neuronal (NeuN), microglial (IBA1) and astrocyte (GFAP) co-staining. Top, control transgene activity. Bottom, synN1 activity. The arrows indicate colocalization between LacZ signals and neurons. Scale bars, 20 μm. Results were replicated in n = 3 negative control and synN1 mice each, using n = 5 sagittal slices per mouse. f, The proportion of neurons, astrocytes and microglia positive for the transgene. n = 3 mice. Statistical analysis was performed using Kruskal–Wallis one-way analysis of variance; ****adjusted P < 10−4. For the box plots, the centre line shows the 50th percentile, the box limits show the 25th and 75th percentiles, and the whiskers indicate the outermost point within 1.5× the interquartile range from the edges of the boxes. g, LacZ expression by synN1 was measured using RNA-sequencing (RNA-seq) normalized to the lacZ expression in transgenic mice for the minP empty vector. Data are mean ± s.e.m. Statistical analysis was performed using two-sided Wald tests. n = 3 mice per genotype. h, synN1 functional characterization. Top, SK-N-SH cell contribution scores. ETS- and CREB-like binding motifs are highlighted. Bottom, single-nucleotide MPRA saturation mutagenesis. The circles represent the expression change from each mutation (A, green; C, blue; G, yellow; T, red). The letter height represents the negative mean mutational expression change.

