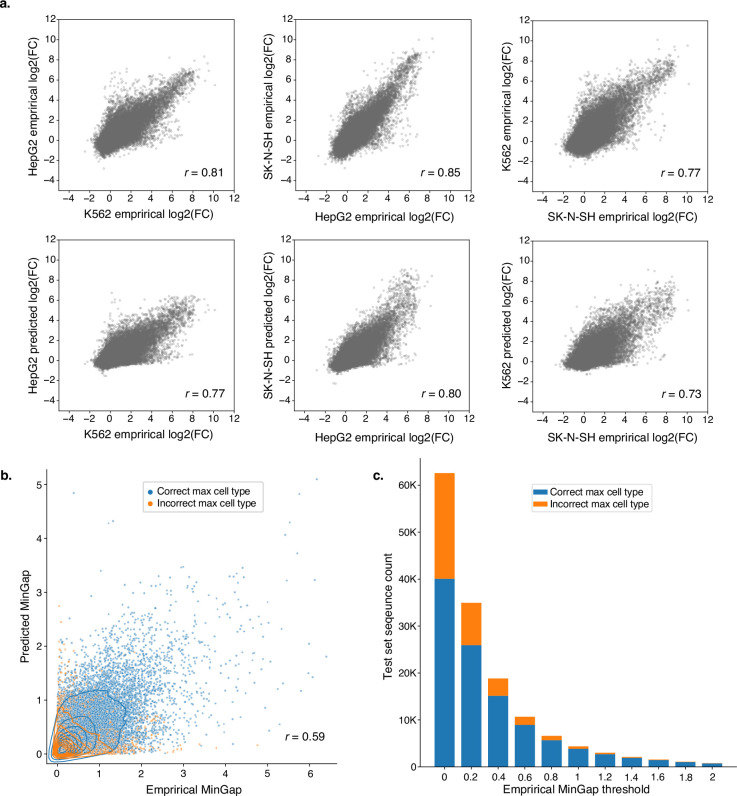
Extended Data Fig. 1. Cell type accuracy of model.
(a) Cross cell-type activity comparisons between empirical measurements and Malinois predictions organize and correlate similarly to empirical-to-empirical comparisons. Top scatter plots: empirical vs empirical cross-cell-type log2(FC). Bottom scatter plots: empirical vs predicted cross-cell-type log2(FC). Number of sequences n = 62,582. Pearson correlation coefficients are shown in the left-bottom corner of each scatter plot. All p-values < 1e-300. (b) Malinois can be used to identify highly active cell type-specific CREs. MinGap scores calculated using Malinois predictions correlate well with MPRA MinGap measurements for sequences in the held-out test set. Points are coloured based on correct prediction of maximally active cell type by Malinois. (c) Malinois predictions of cell type associated with maximum CRE function are more accurate for sequences with high empirical specificity. Stacked bar plot displaying number of sequences in the test set falling into discrete bins based on an empirically measured MinGap threshold. Lower boundary of each bin is indicated on the x-axis and hue delineates sequences that are categorized correctly (blue) or incorrectly (orange). Number of sequences n = 62,582, p-value < 1e-300.

