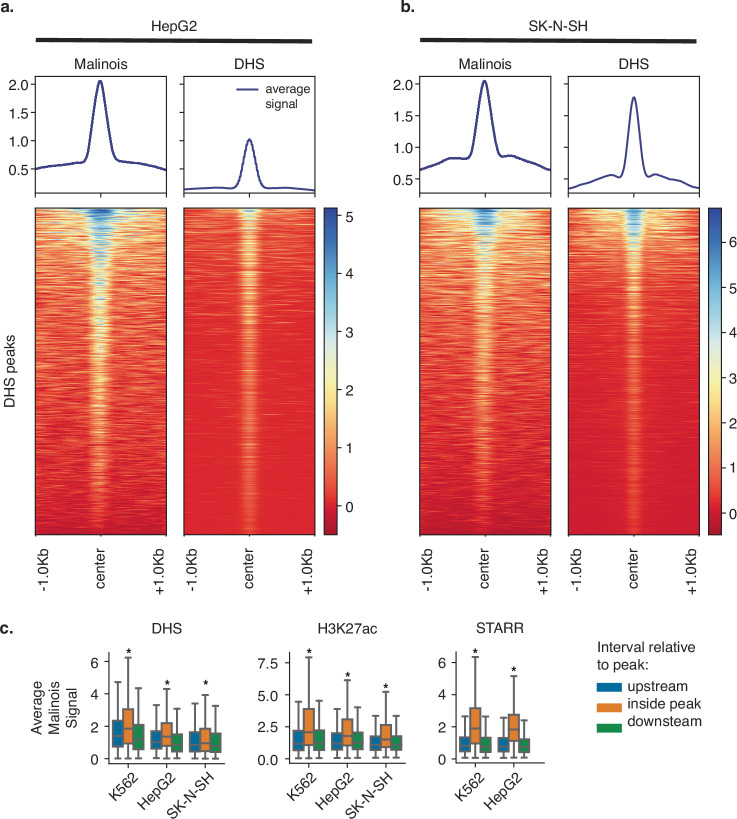
Extended Data Fig. 2. Malinois concordance with DHS/H3K27ac/STARR.
(a) Malinois genome-wide predictions correspond well with DHS signal in HepG2. Deeptools plots of Malinois genome-wide predictions and DHS signal centred at DHS peaks in HepG2 cell lines on chromosome 13 (n = 1,188 peaks). (b) DHS signal and Malinois genome-wide predictions are also similar in SK-N-SH. Similar Deeptools plots to a except using SK-N-SH derived data (n = 3,512 peaks). (c) Malinois genome-wide predictions are significantly associated with candidate CRE mapping (DHS-seq, and H3K27ac ChIP-seq) and orthogonal signals of CRE functional characterization (STARR-seq). Boxplots display average signal generated by Malinois genome-wide predictions within peaks on chromosome 13 annotated using DHS, H3K27ac, or STARR-seq (orange) compared to paired upstream (blue) and downstream (green) flanking regions. Boxes demarcate the 25th, 50th, and 75th percentile values, while whiskers indicate the outermost point within 1.5 times the interquartile range from the edges of the boxes. Stars indicate a significant (p-value < 10−100) for two t-tests comparing signals within peaks and both upstream and downstream regions outside of peaks (from left-to-right, comparisons made using n = 2,413; 1,188; 3,512; 836; 1,119; 1,993; 1,157; and 1,670 peaks).

