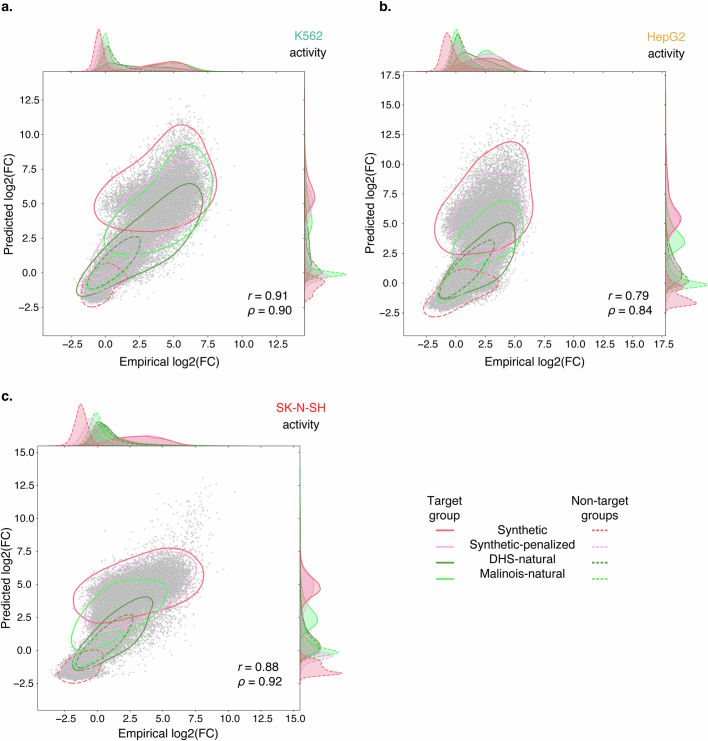
Extended Data Fig. 4. Library prediction validation plots.
(a) Prospective Malinois predictions of candidate cell type-specific CRE activity is correlated with experimental measurements across all three tested cell types. The scatter plot corresponds to predictions and measurements made in K562. Solid contour lines demarcate 95% density of points corresponding to candidate CRE expected to drive expression in K562. Dotted contour lines indicate 95% density of CREs expected to drive specific expression in one of the other two cell types. Colour indicates sequence selection or generation method. One-dimensional density estimates along axes share the same line style and colour associations. Sequences with a replicate log2FC standard error greater than 1 in any cell type were omitted from the plots. Number of sequences n = 69,550; p-values < 1e-300. (b) Same as a, but in HepG2. Number of sequences n = 69,550; p-values < 1e−300. (c) Same as a, but in SK-N-SH. Number of sequences n = 69,550; p-values < 1e-300.

