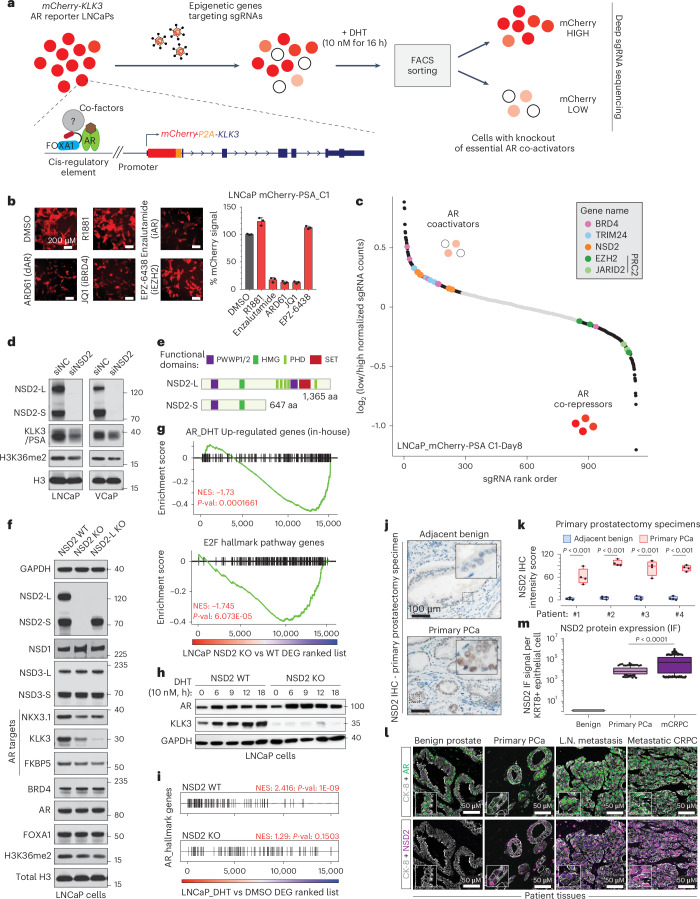
Fig. 1. Epigenetics-focused CRISPR screen shows NSD2 as an AR coactivator.
a, Schematic of the epigenetic-targeted CRISPR screen using LNCaP-mCherry-KLK3 AR reporter lines. b, Left: mCherry immunofluorescence images of LNCaP reporters treated with labeled epigenetic drugs. Right: Barplot showing quantification of the mCherry signal from treated reporter cells normalized to the DMSO treatment (n = 3 biological replicates). Mean ± standard error of the mean (s.e.m.) are shown. Scale bar: 200 µm. c, sgRNA enrichment rank plot based on guide RNA ratio in mCherry-LOW to mCherry-HIGH cells. d, Immunoblots of listed proteins upon treatment with control (siNC) or NSD2-targeting (siNSD2) siRNAs. Total H3 is used as loading control. LNCaP lysates were collected at day 15. VCaP lysates were collected at day 10 or 15 after treatment. e, Representative protein map of NSD2-Long (NSD2-L) and NSD2-Short (NSD2-S) isoforms. HMG: High mobility group; PHD: Plant homeodomain. f, Immunoblots of noted proteins in CRISPR-mediated stable knockout (KO) of both NSD2 isoforms or NSD2-L alone. Total H3 is used as loading control. g, Gene set enrichment analysis (GSEA) plots for AR and E2F upregulated genes using the fold-change rank-ordered genes from the NSD2 knockout (KO) vs wild-type (WT) LNCaP cells. DEGS, differentially expressed genes (n = 2 biological replicates; GSEA enrichment test). h, Immunoblots of listed proteins in NSD2-KO LNCaP cells stimulated with 10 nM DHT. i, GSEA plots of AR hallmark genes in NSD2 wild-type (WT) vs knockout (KO) LNCaP cells using the fold-change rank-ordered genes from DHT (10 nM for 24 h) vs DMSO treatment. DEGS, differentially expressed genes (n = 2 biological replicates; GSEA enrichment test). j, Representative immunohistochemistry (IHC) images of NSD2 in prostatectomy patient specimens. Scale bar: 100 µm. k, NSD2 signal intensity from IHC staining in panel j (n = 4 patient tumors; two-sided t-test). Box plot center, median; box, quartiles 1-3, whiskers, quartiles 1-3 ± 1.5× interquartile range, dot, outliers. l, Representative multiplex immunofluorescence (IF) images of KRT8, AR, and NSD2 in benign prostate, primary PCa or mCRPC patient specimens. Scale bar: 5 µm. m, Quantification of NSD2 IF signal intensity per KRT8+ luminal epithelial cell from images in panel l (two-sided t-test; Normal=39, primary PCa = 145, mCRPC=381 nuclei). Box plot center, median; box, quartile 1-3; whiskers, 10th and 90th percentile; dot, outliers.

