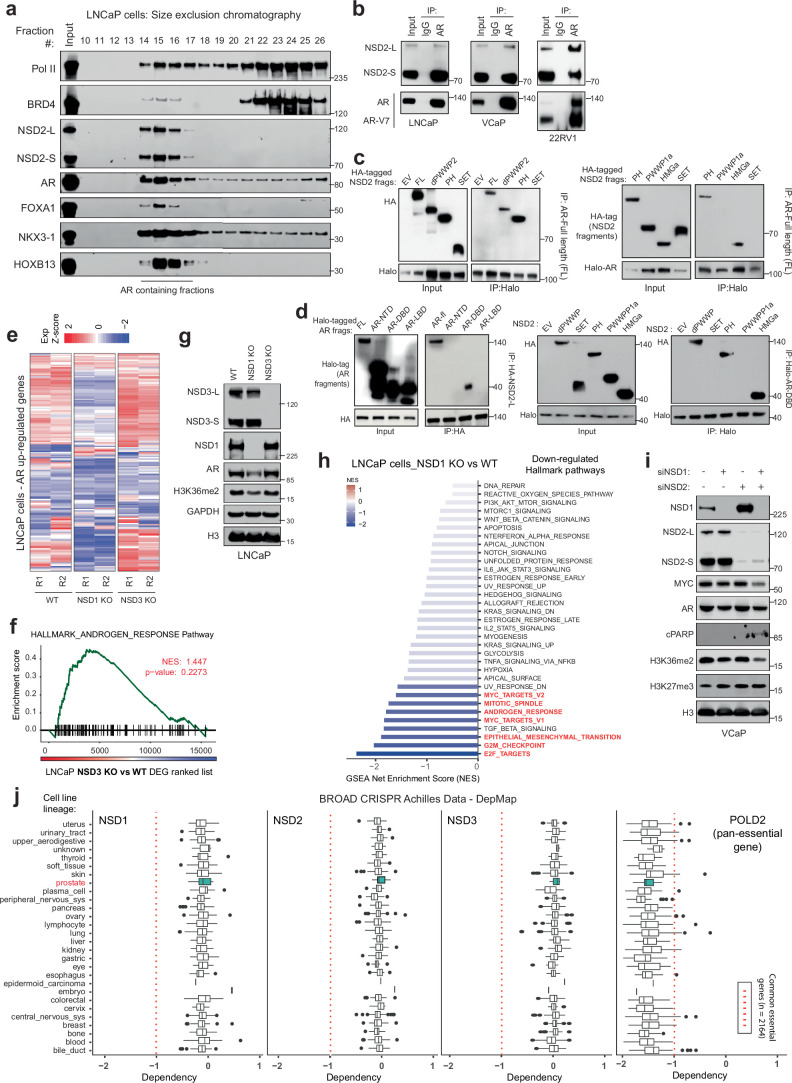
Extended Data Fig. 7. Fragment-based NSD2–AR coimmunoprecipitation and characterization of the NSD paralog knockout prostate cancer cells.
a) Immunoblots of noted proteins in size-exclusion chromatography fractions of nuclear lysate extracted from wild-type LNCaP cells. Fractions containing the AR protein are marked. b) Immunoblots of indicated proteins upon coimmunoprecipitation of AR in prostate cancer cells. c) Immunoblots of indicated proteins upon immunoprecipitation of exogenously expressed Halo-tagged full-length AR protein in HEK293FT cells that express HA-tagged NSD2 fragments. Both input (left) and immunoprecipitation (right) blots are shown. d) Left: Immunoblots of HA-tag-based immunoprecipitation of full-length NSD2 in HEK293FT cells that express the Halo-tagged AR protein fragments. Right: Immunoblots of Halo-tag-based immunoprecipitation of the DNA-binding domain (DBD) of AR in HEK293FT cells that overexpress different HA-tagged NSD2 fragments. For both experiments, input and immunoprecipitation blots are shown. e) Heatmap of AR upregulated genes (z-score) in NSD1 or NSD3 knockout (KO) LNCaP cells. f) GSEA plots for AR-regulated genes using the fold-change rank-ordered genes from LNCaP NSD3 knockout (NSD3 KO) vs control cell lines. DEGS, differentially expressed genes (n = 2 biological replicates; GSEA enrichment test). g) Immunoblot of indicated proteins in NSD1 or NSD3-deficient LNCaP cells. h) GSEA net enrichment score (NES) plot of downregulated hallmark pathways in LNCaP NSD1 knocked out (KO) vs wild-type control cells. i) Immunoblot of indicated proteins upon treatment with NSD1 and NSD2-targeting siRNAs (labeled as siNSD1 and siNSD2) independently or in combination in VCaP cells. j) Dependency map (DepMap) plots showing the dependency scores for NSD1, NSD2, NSD3, and POLD2 (positive control; pan-essential gene) across cell lines from distinct originating tissues. The red dotted line indicates pan-essentiality z-score cutoff. Box plot center, median; box, quartiles 1-3; whiskers, quartiles 1-3 ± 1.5 × interquartile range; dot, outliers.

