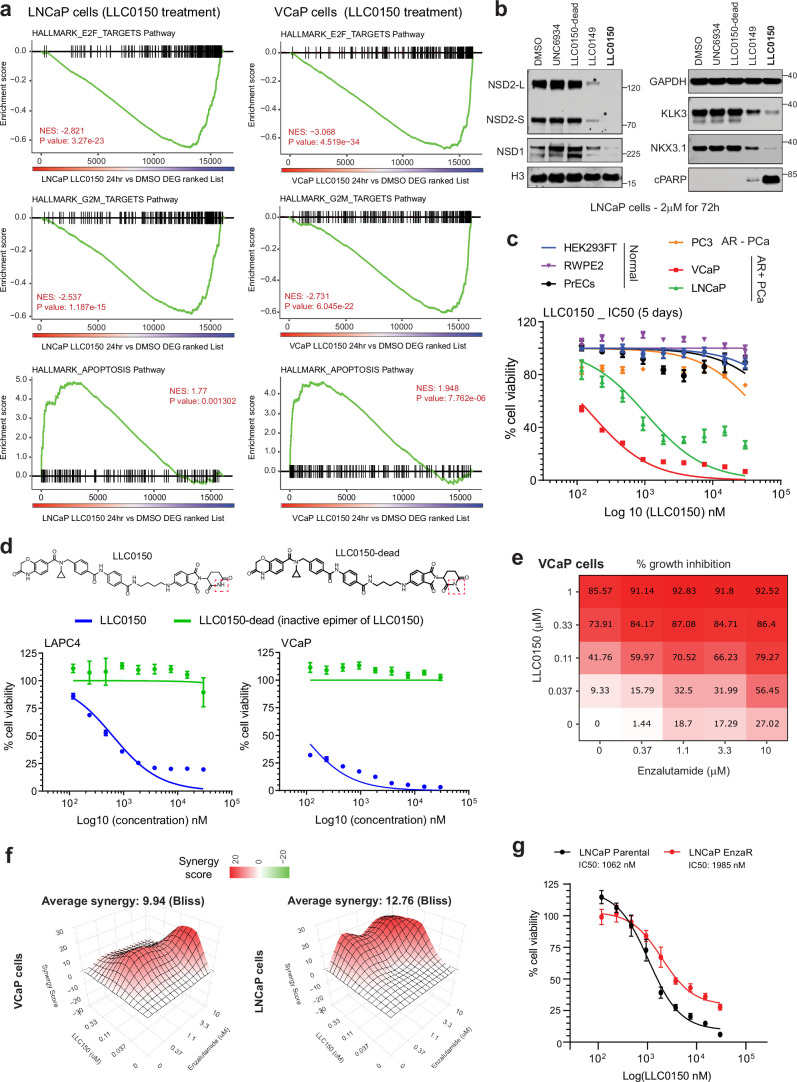
Extended Data Fig. 9. Transcriptomic effect and drug synergism of LLC0150 in prostate cancer cells.
a) GSEA plots for E2F, G2M, and apoptosis pathway genes using the fold-change rank-ordered genes from the LLC0150 vs DMSO treated LNCaP (left) or VCaP (right) cell lines. DEGS, differentially expressed genes (n = 2 biological replicates; GSEA enrichment test). b) Immunoblot of noted proteins in LNCaP cells treated with LLC0150 (2uM for 72 h), dead-analog (LLC0150-dead), or the warhead alone (UNC6934). LLC0149 is an independent NSD1/2 PROTAC. c) Dose-response curves of LLC0150 in normal prostate, AR-positive, or AR-negative prostate cancer cell lines at the indicated concentrations for five days. (PrECs, n = 3 biological replicates; others, n = 6 biological replicates). Mean +/- SEM are shown. d) Dose-response curves of LLC0150 and its inactive epimer control (LLC0150-dead) in LAPC4 and VCaP cell lines (n = 6 biological replicates). Mean +/- SEM are shown. e) Percent growth inhibition (Cell-titer Glo) of VCaP cells upon co-treatment with varying concentrations of LLC0150 and enzalutamide for 5 days. f) 3D synergy plots of LLC0150 and enzalutamide co-treated LNCaP and VCaP cells. Red peaks in the 3D plots denote synergy with the average synergy scores noted above. g) Dose-response curves of LLC0150 in LNCaP parental and enzalutamide-resistant cell lines at varying concentrations for five days. Half-maximal inhibitory concentrations (IC50) are noted (n = 5 biological replicates). Mean +/- SEM are shown.

