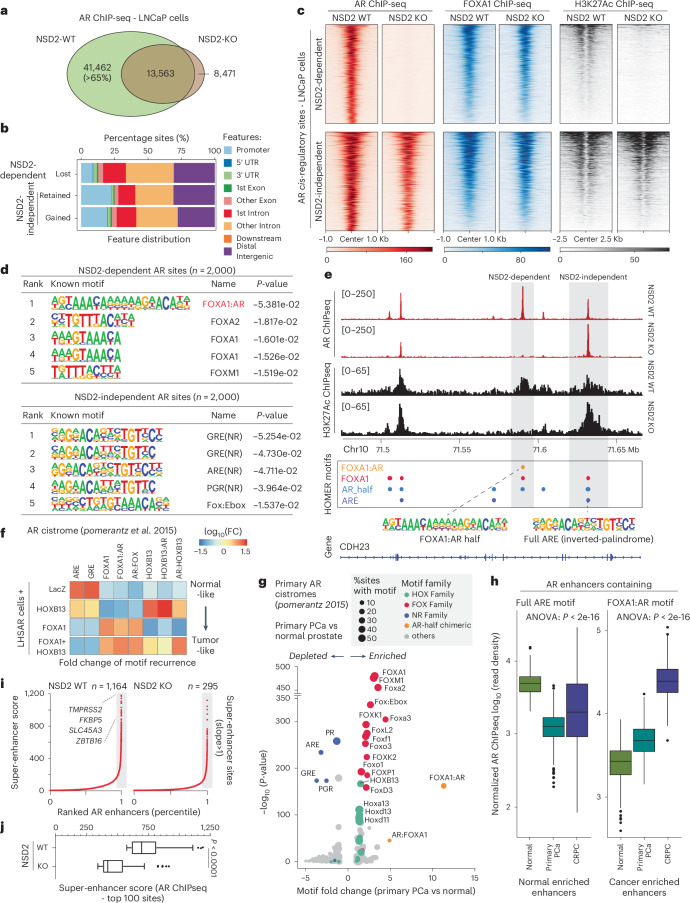
Fig. 2. NSD2 expands the AR neo-enhancer circuitry to include chimeric AR half-sites.
a, Venn diagram showing overlaps of AR ChIP-seq peaks in NSD2 wild-type (WT) and knockout (KO) LNCaP cell lines. b, Genomic location of NSD2-dependent and independent AR sites defined from the overlap analysis in panel a. c, ChIP-seq read-density heatmaps of AR, FOXA1, and H3K27ac at top 1,000 AR enhancer sites in LNCaP NSD2 WT and KO cell lines. d, Top five known HOMER motifs enriched within NSD2-dependent and independent AR sites in LNCaP cells (HOMER, hypergeometric test). e, ChIP-seq read-density tracks of AR and H3K27ac in NSD2 WT and KO LNCaP cell lines. HOMER motifs detected within AR peaks are shown below with gray boxes highlighting NSD2-dependent and independent AR elements. f, Fold-change heatmap of HOMER motifs enrichment within AR binding sites specific to HOXB13, FOXA1 or FOXA1 + HOXB13 overexpression in LHSAR cells (data from Pomerantz et al.5). g, Fold-change and significance of HOMER motifs enriched within primary PCa-specific AR sites over normal AR enhancers (data from Pomerantz et al.5; HOMER, hypergeometric test). h, AR ChIP-seq read-density box plot at sites containing the ARE or the FOXA1:AR chimeric motif in primary normal and tumor patient samples (normal prostate, n = 7; primary PCa, n = 13; mCRPC, n = 15). In box plots, the center line shows the median, box edges mark quartiles 1-3, and whiskers span quartiles 1-3 ± 1.5× interquartile range (one-way ANOVA). i, Rank-ordered plot of AR super-enhancers (HOMER ROSE algorithm) in NSD2 WT and KO LNCaP cells with select known AR target genes shown. j, Box plot of AR super-enhancer scores (HOMER ROSE algorithm) of top 100 cis-elements in NSD2 WT or KO LNCaP cells (two-sided t-test). Box plot center, median; box, quartiles 1-3; whiskers, quartiles 1-3 ± 1.5× interquartile range; dot, outliers.

