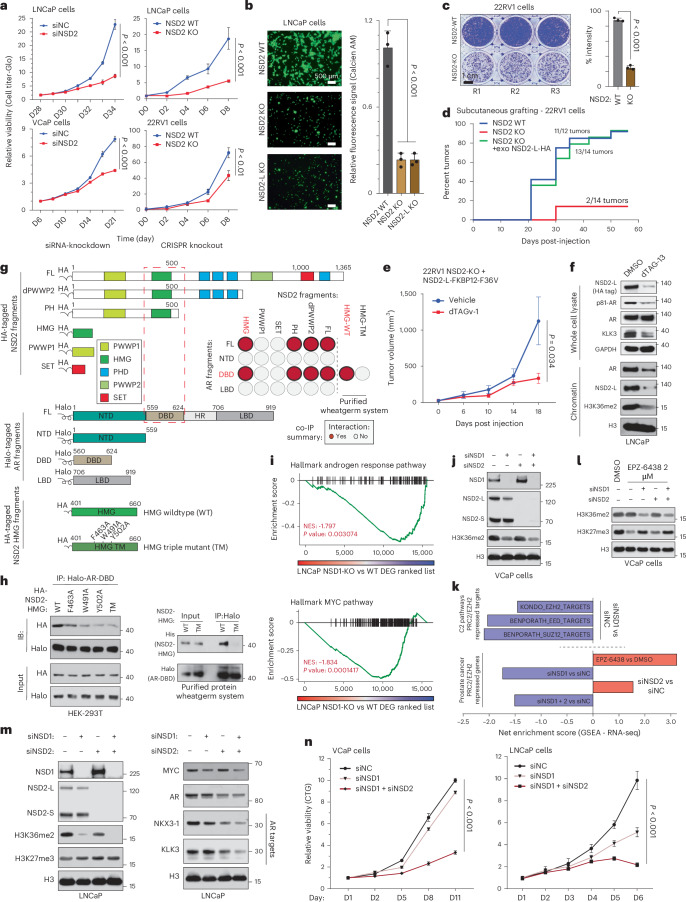
Fig. 3. NSD1 and NSD2 independently enable oncogenic AR activity.
a, Left: Growth curves of cells treated with control (siNC) or NSD2-targeting siRNAs (n = 6 biological replicates; two-sided t-test). Right: Growth curves of NSD2 knockout (KO) or wild-type (WT) cells (n = 3 biological replicates; two-sided t-test). Mean ± s.e.m. are shown. b, Left: Boyden chamber images of NSD2-KO and WT cells. Scale bar: 500 µm. Right: Quantification of fluorescence signal (n = 3 biological replication; one-way ANOVA + Tukey’s test). Mean ± s.e.m. are shown. c, Left: Representative images of NSD2-KO and WT 22RV1 cell colonies (n = 3 biological replicates). Scale bar: 1 cm. Right: Staining intensity of cell colonies (two-sided t-test). Mean ± s.e.m. are shown. d, Reverse Kaplan-Meier plot of tumor grafting of 22RV1 WT, NSD2-KO, or NSD2-KO + NSD2-L cells. e, Tumor volumes of 22RV1 NSD2-KO + NSD2-L-FKBP12F36V xenografts ± dTAGv-1 treatment. Mean ± s.e.m. are shown (n = 10 biological replicates; two-sided t-test). f, Immunoblots of listed proteins in whole-cell or chromatin fractions of LNCaP NSD2-FKBP12F36V cells ± dTAG-13. g, Schematic of coimmunoprecipitation (coIP) protein fragments. Dashed red box marks interacting domains. Inset: AR-NSD2 co-IP interaction summary. Red circles, interaction. Gray circles, no detectable binding. h, Left: co-IP immunoblots of AR DNA-binding domain (DBD) with HA-NSD2-HMG mutants. TM, triple mutant. Right: co-IP immunoblots of wheatgerm-purified Halo-AR-DBD with His-NSD2-HMG fragments. Input fractions are shown as control. i, GSEA plots for AR and MYC target genes in NSD1 KO vs WT LNCaP cells. DEGS, differentially expressed genes (n = 2 biological replicates; GSEA enrichment test). j, Immunoblots of labeled proteins upon treatment with siNC or NSD1 and/or NSD2 targeting siRNAs (siNSD1 or siNSD2). H3 is a loading control. k, Top: GSEA enrichment scores of EZH2/PRC2-repressed genesets in siNSD1 versus siNC-treated cells. Bottom: GSEA enrichment scores of PCa-specific EZH2 signature in siNSD1 and/or siNSD2 vs siNC-treated cells. l, Immunoblots of noted proteins in siNSD1 and/or siNSD2 treated cells ± EPZ-6438. m, Immunoblot of listed proteins in siNC or siNSD1 and/or siNSD2 treated cells. n, Left: Growth curves of cells treated with siNC, siNSD1 or siNSD1 + NSD2. Right: Growth curves of control (sgNC) or NSD1-deficient (sgNSD1) cells ± siNSD2 treatment (n = 5 biological replicates; two-sided t-test). Mean ± s.e.m. are shown.

