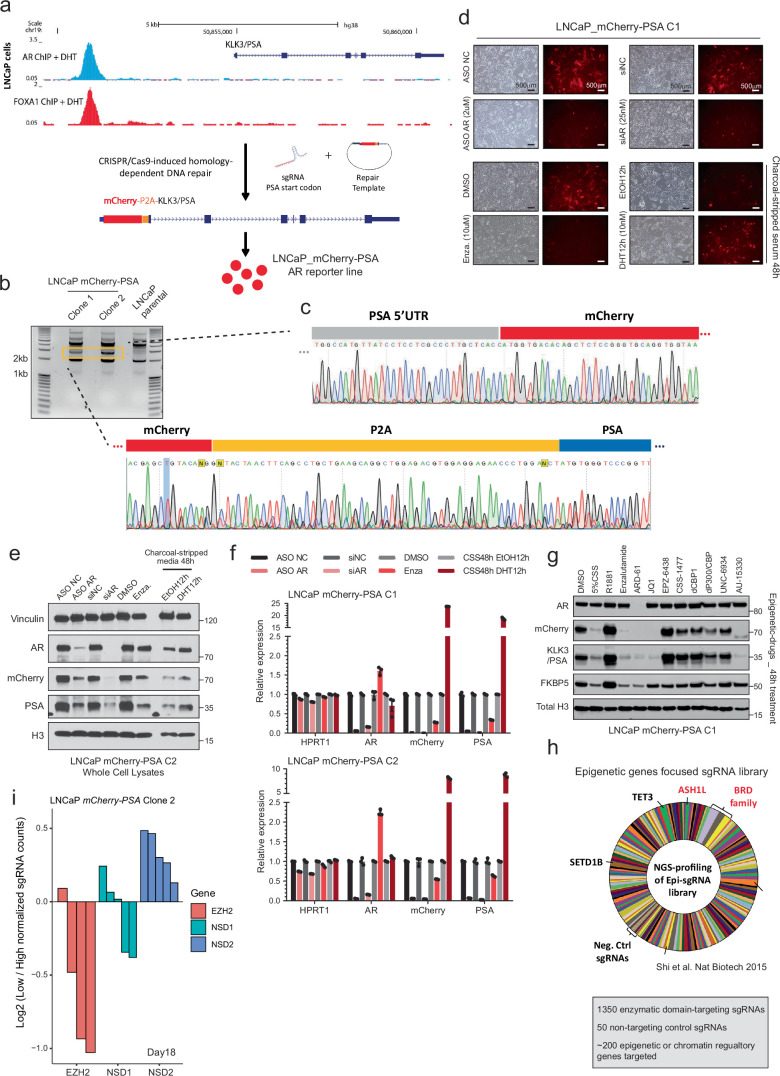
Extended Data Fig. 1. Generation and characterization of the endogenous mCherry-PSA AR reporter cell lines.
a) Schematic representation of the workflow of LNCaP-mCherry-PSA AR reporter cell line generation. b) DNA gel electrophoresis image showing the exogenously inserted mCherry amplicon in the LNCaP-mCherry-PSA lines. Clones 1 and 2 were used for the functional CRISPR screen. c) Sanger sequencing chromatograms of the PCR amplicon from reporter cells in panel (b) showing the KLK3/PSA gene promoter and exon 1 start codon junctions. d) Representative brightfield and mCherry immunofluorescence images of the LNCaP-mCherry-PSA clone 1 treated with (top) AR-targeting siRNA or antisense oligonucleotides (ASOs) (siAR and ASO AR respectively) or enzalutamide (bottom left). Reporter cells were also serum starved for 48 h and stimulated with DHT (10 nM for 12 h) to showcase gain in signal (bottom right). All treatments were repeated at least twice. Scale bar: 500 µm. e) Immunoblots of noted proteins in LNCaP reporter cells as in panel (d). f) Expression (qPCR) of noted genes in reporter monoclones treated as in panel (d) to manipulate AR signaling (n = 3 biological replicates). Mean +/- SEM is shown. g) Immunoblots of noted proteins, including the exogenously introduced mCherry protein, in LNCaP reporter cells treated with AR-targeting epigenetic drugs. Total H3 is used as a loading control. h) Next-generation sequencing-based abundance of sgRNAs in the epigenetic-focused library used in the CRISPR screen highlighting some of the known epigenetic regulators of AR. i) Individual NSD1, NSD2, or EZH2-targeting sgRNA ratios in mCherry-LOW to mCherry-HIGH cells in the CRISPR screen.

