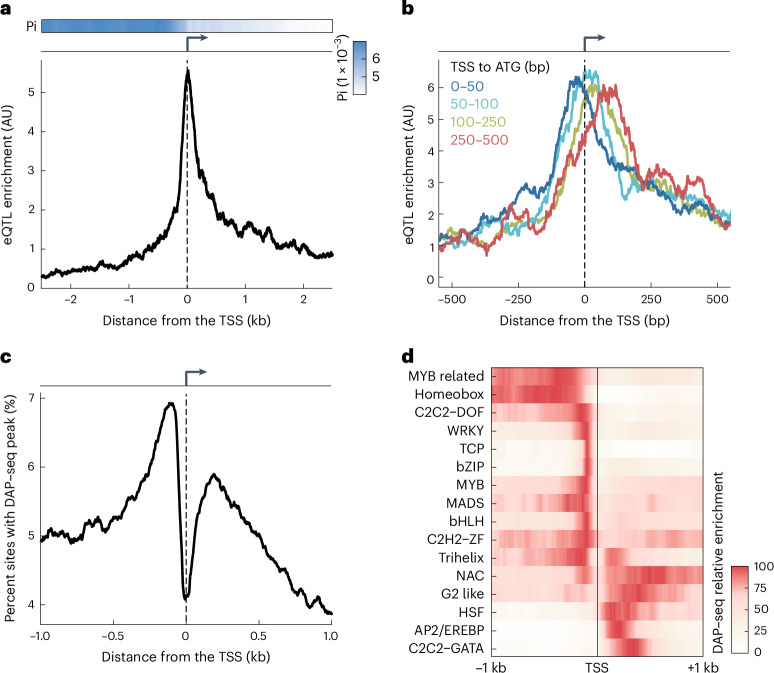
Fig. 1. Evidence for transcriptional regulatory sequences downstream of the TSS.
a, eQTL enrichment (below) and nucleotide diversity (Pi, above) near TSSs. b, eQTL enrichment for genes with different TSS-to-ATG distances. Group counts: 1,088 (0–50 bp, dark blue), 968 (50–100 bp, light blue), 1,122 (100–250 bp, green) and 577 (250–500 bp, red). c, Proportion of sites with a DAP–seq19 peak center, based on data for 529 TFs. d, DAP–seq peak enrichment, as in c, consolidated for each TF family with at least ten members in the dataset19; the maximum signal for each TF family was scaled to 100. In a–c, data are smoothed using a 100-bp rolling window. AU, arbitrary units.

