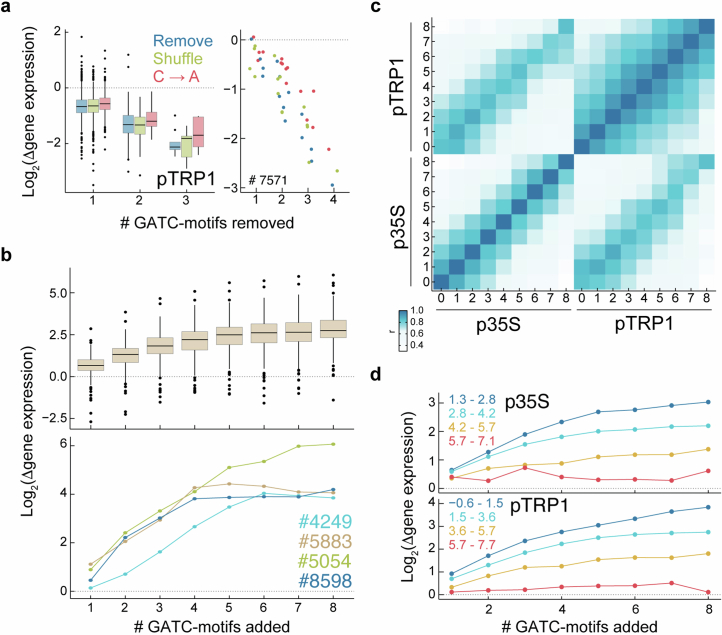
Extended Data Fig. 6. Impact of GATC-motif mutations on gene expression in MPRA.
(a) Expression change after removing GATC motifs in a pTRP1-based library, plotted as in Fig. 4a. Illustrated effects across 823 fragments (left) and an example fragment with originally 4 motifs (right). (b) Expression changes due to GATC-motifs additions in a pTRP1-based library, mirroring Fig. 4c. Effects across 221 fragments (top) and 4 specific examples (bottom). (c) Pearson’s correlation coefficients between expression of 221 fragments with varying GATC-motif additions in p35S- and pTRP1-based libraries. (d) Influence of GATC-motif additions depends on initial sequence expression. Depicted is the average log2 expression difference upon motif addition relative to original fragments, for different copy numbers of the added motif. Color indicates original fragment (log2) expression level ranges, as indicated. Plotted for p35S- (top) and pTRP1-based libraries (bottom). Boxplots in a,b represent the median (center line), IQR (box bounds), whiskers (min and max within 1.5 IQR), and outliers (points beyond whiskers).

