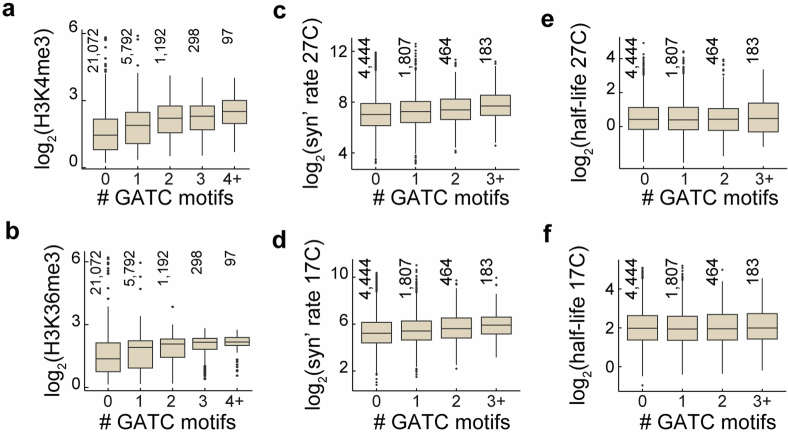
Extended Data Fig. 8. Association between GATC-motifs count and histone modification, mRNA synthesis rate, and mRNA half-life.
(a-b) Average log2 enrichment of H3K4me3 (a) and H3K36me3 (b) across genes27,67–69 categorized by GATC-motif counts within 500 bp downstream of the TSS, as in Fig. 5a. H3K4me3 and H3K36me3 effect sizes are 0.27 (p-value: 3×10−300) and 0.2 (p-value: 4.4×10−194), respectively. (c-d) mRNA synthesis rates for 7,291 genes at 27 °C (c) and 17 °C (d), plotted by GATC-motif counts29. Genes with motif counts >=3 are grouped. Effect sizes are 0.17 (p-value: 2.9×10⁻¹⁶) at 17 °C and 0.18 (p-value: 8.8×10⁻¹⁹) at 27 °C. (e-f) mRNA half-lives at 27 °C (e) and 17 °C (f), plotted similarly to c-d. No significant associations were found between GATC-motif and mRNA half-lives29, with effect sizes of 0.01 (p-value: 0.4) at 17 °C and −0.01 (p-value: 0.6) at 27 °C. Boxplots display the median (center line), IQR (box bounds), whiskers (min and max within 1.5 IQR), and outliers (points beyond whiskers). Number of genes per box plot is indicated. p-values are calculated using a two-sided t-statistic.

